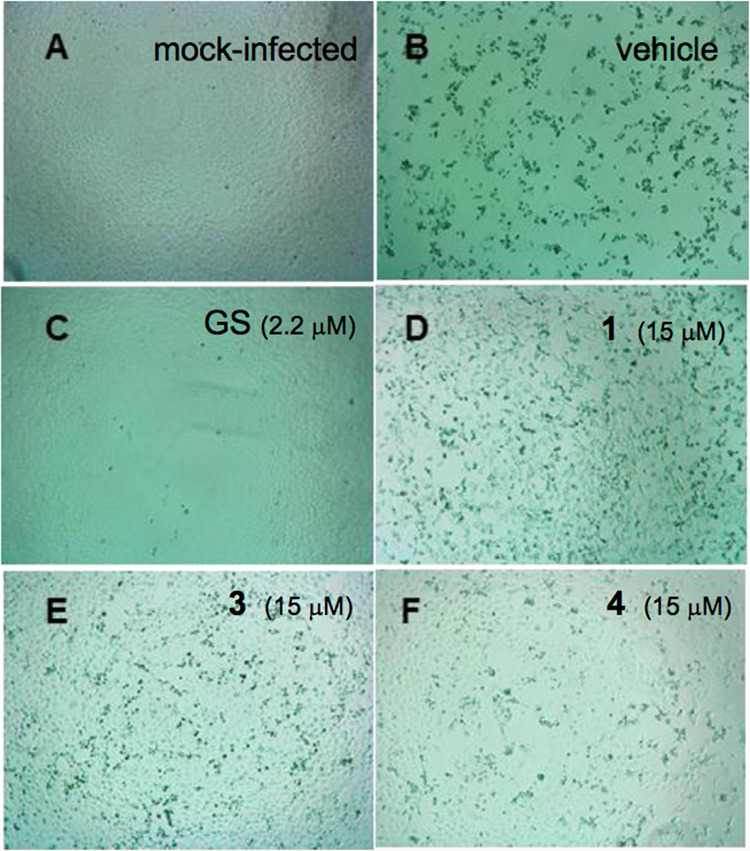
Figure 8.

Microscopic evaluation of dose–response data. Microscopic evaluation of monolayers of Vero E6 cells after 96 h infection with SARS-CoV-2. Images from infected cells (B–F), or mock-infected cells (A) are shown after infection for 4 days with SARS-CoV-2 in the presence of inhibitors. (A) Mock-infected cells; (B) infection in the presence of vehicle alone; (C) infection with 2.2 μM GS-441524; (D) infection with 1 (15 μM); (E) infection with 3 (15 μM); and (F) infection with 4 (15 μM).
