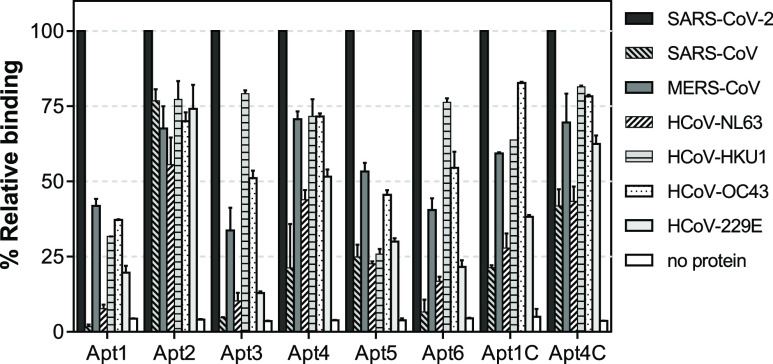
Figure 2.
Specificity of the aptamers evaluated by direct ELAA. The relative binding of each aptamer was calculated using constant concentrations of aptamers (200 nM) and S1 proteins from the different HCoV’s (2 μg/mL). The error bars correspond to the standard deviation from duplicate measurements.

