
Figure 1. BCG treatment increases tumor-specific immunity in patients and anti-tumor protection in a mouse model.
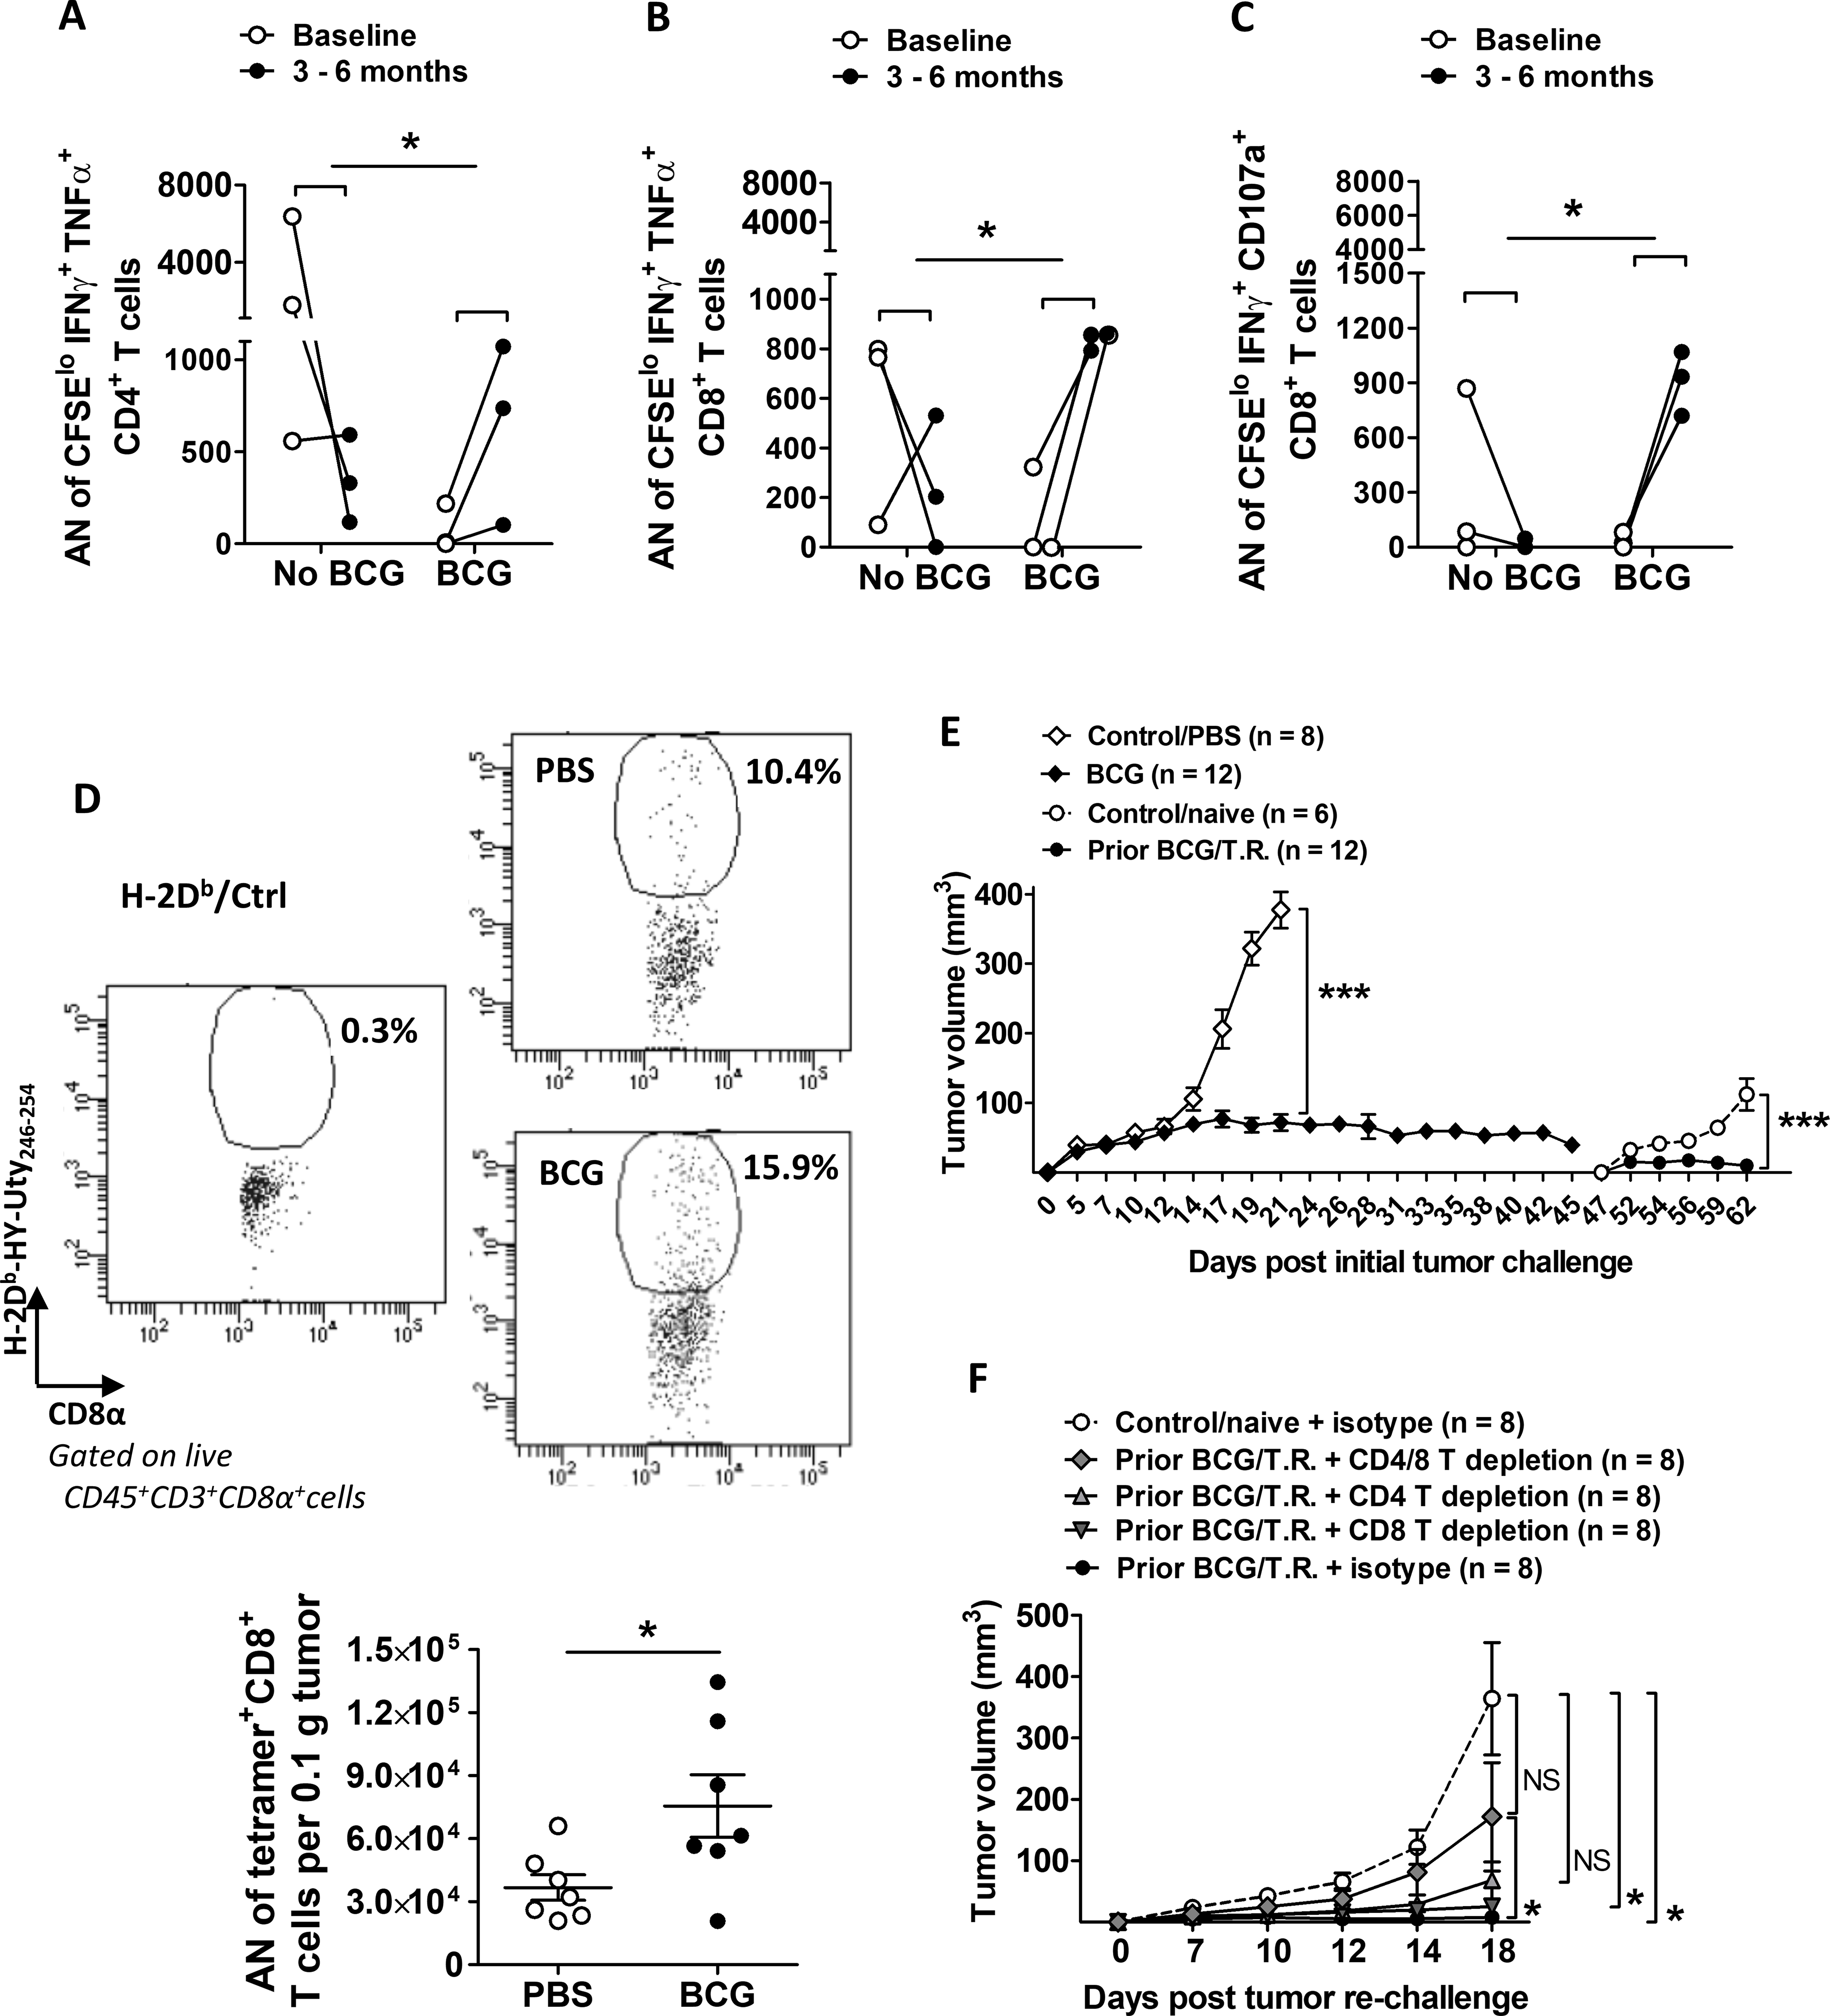
(A-C) As described in Materials and Methods, patient PBMCs harvested from baseline and at 3–6 months post BCG treatment were measured for tumor-specific responses. Paired samples indicated with lines. Shown are absolute number (AN) of (A) proliferating CD4+ or (B-C) proliferating CD8+ T cells co-expressing IFNγ and TNFα or CD107a. (n=3 patients per group). P value indicates the difference in changes between baseline and 3–6 months assessed with two-sided testing on the group (baseline, 3–6 months) by condition (no BCG, BCG) interaction term in a linear model. (D-F) WT female C57BL/6 mice were challenged with s.c. MB49 tumors and treated with BCG intratumorally weekly for 3 weeks starting on day 5. For some experiments, (D) mice were sacrificed around day 25 when tumors were harvested for immune analysis mainly for H-2Db-HY-Uty tetramer staining on CD8+ T cells (gated under FVD−CD45+CD3+CD8+ cells) using an unspecific-peptide loaded tetramer (H-2Db/Ctrl) as negative control (top panel, examples of flow dot plots for gating strategy). AN of tetramer+ CD8+ T cells per 0.1 g of tumor tissue (n=7 tumors per group) were calculated accordingly (bottom graph). Shown is representative of 3 independent experiments. Mean±SEM. Each dot represents one tumor. t-test was applied accordingly after normality test was run. (E), BCG groups (gray diamonds) compared to PBS control (open diamonds). After 45 days mice with prior BCG treatment and regressed tumors were re-challenged with s.c. MB49 cells versus a cohort of naïve mice (open circles). Shown is representative of 3 independent experiments (n=number of tumors). Two-way ANOVA for comparison of control versus treatment groups at either initial or secondary tumor challenge. Mean±SEM. (F) Used prior BCG treated/tumor regressed mice, as in (E), with or without CD4 and/or CD8 T-cell depletion or isotype antibodies. Shown is representative of 2 independent experiments (n = number of tumors). Repeated measures ANOVA with Dunnett’s multiple comparison test. Mean±SEM. T.R.=tumor regressed. *, p<0.05; ***, p<0.001; NS, not significant.