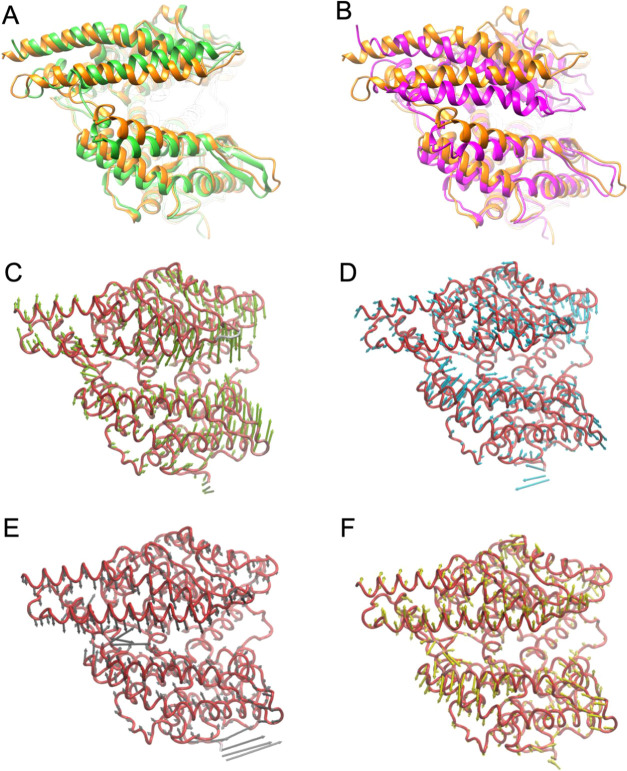
Figure 2.
Dynamic states of ACE2 complexed with the activator BAR708. (A, B) Superimposition on the Sub II protein backbone between (A) the most populated cluster over 1.5 μs MD of the BAR708/ACE2 complex (orange cartoon) and the X-ray structure of the open apo ACE2 (PDB ID 1R42; green cartoon) and (B) the most populated cluster over 1.5 μs MD of the BAR708/ACE2 complex (orange cartoon) and the closed ACE2 complexed with the potent inhibitor MLN-4760 (PDB ID 1R4L; magenta cartoon). (C–F) Correlated motions from the PCA analysis during 1.5 μs MD simulations of the BAR708/ACE2 complex, represented by porcupine plots of the first four vectors (PC1–4). Protein backbones are represented as ribbons, the arrows indicate the direction of the motion, and the length represented the magnitude of the corresponding eigenvalue.

