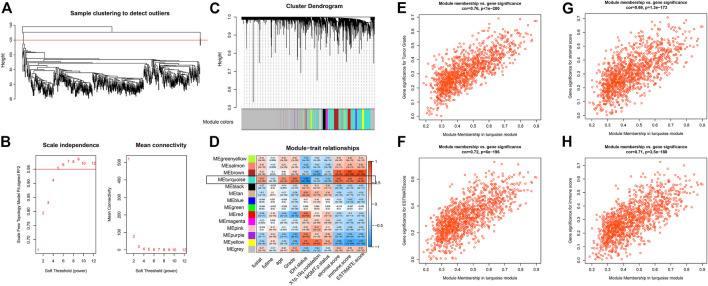
FIGURE 2.
WGCNA using lncRNA expressions (A) Sample clustering to detect outliers (B) Soft threshold selection (C) Cluster dendrogram to distinguish modules (D) Correlation matrix between modules and clinical traits (E–H) Scatter plot with GS and MM in the turquoise module with regard to tumor grade (E), ESTIMATE combined score (F), ESTIMATE stromal score (G), and ESTIMATE immune score (H).

