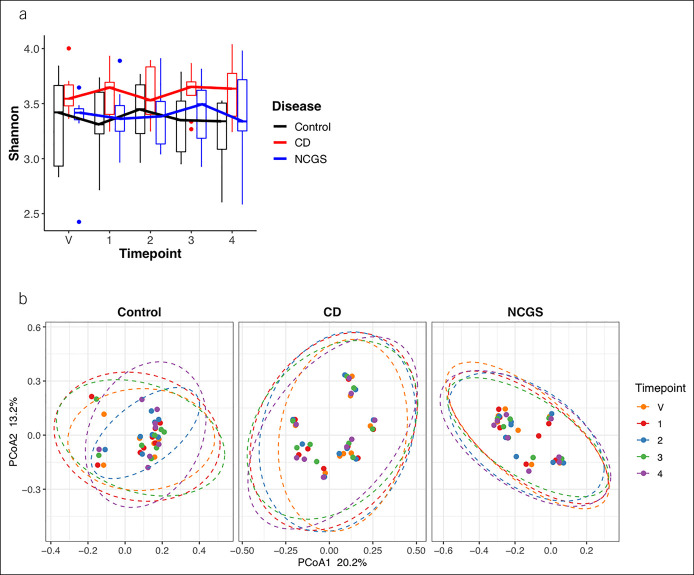
Figure 2.
(a) Alpha diversity in control, CD, and NCGS study groups over time. (b) Beta diversity based on unweighted UniFrac within groups over time. All pairwise comparisons of timepoints within each study group: not significant at alpha = 5%. CD, celiac disease; NCGS, nonceliac gluten sensitivity.

