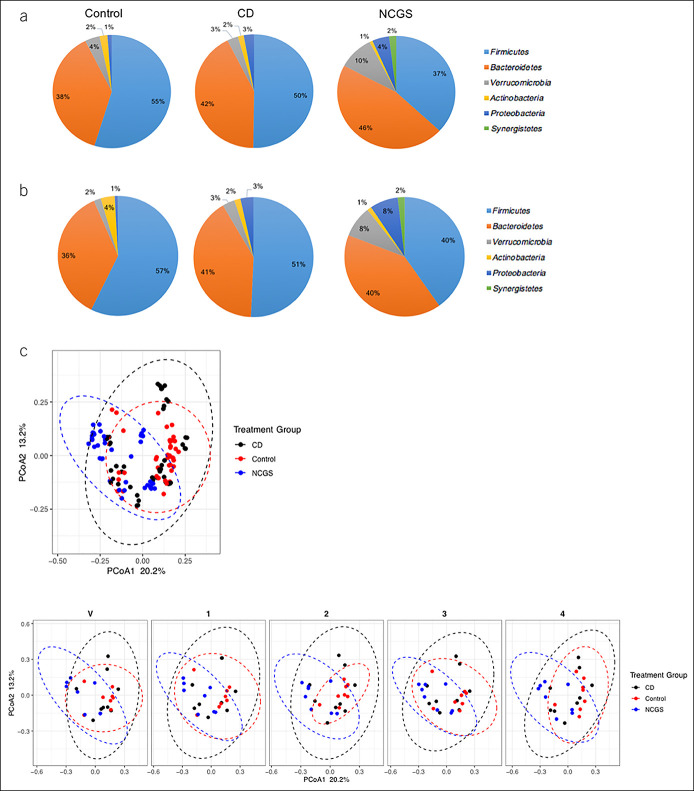
Figure 3.
Microbiome composition in control, CD, and NCGS study groups over time. Relative abundance of phyla at (a) timepoint 1 and (b) timepoint 3. All other phyla had relative abundance <0.5%. (c) Unweighted UniFrac within each group and in the 3 treatment groups over time. Pairwise comparisons between each group, P < 0.01. CD, celiac disease; NCGS, nonceliac gluten sensitivity.

