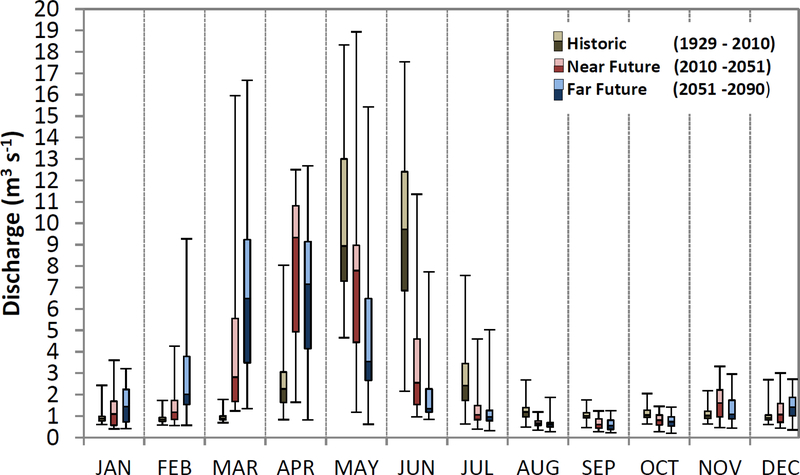
Figure 5:
Box-and-whiskers plot of monthly discharges for historical (H; 1929–2010, left whisker in each month, brown hues), near future (NF; 2011–2050, center whisker, red hues), and far future (FF; 2051–2090, right whisker, blue hues). Future scenarios are for the ensemble climate, EM, scenario. Box gradations represent the 25, 50 and 75th percentiles. Whisker extents represent the maximum and minimum observed values.

