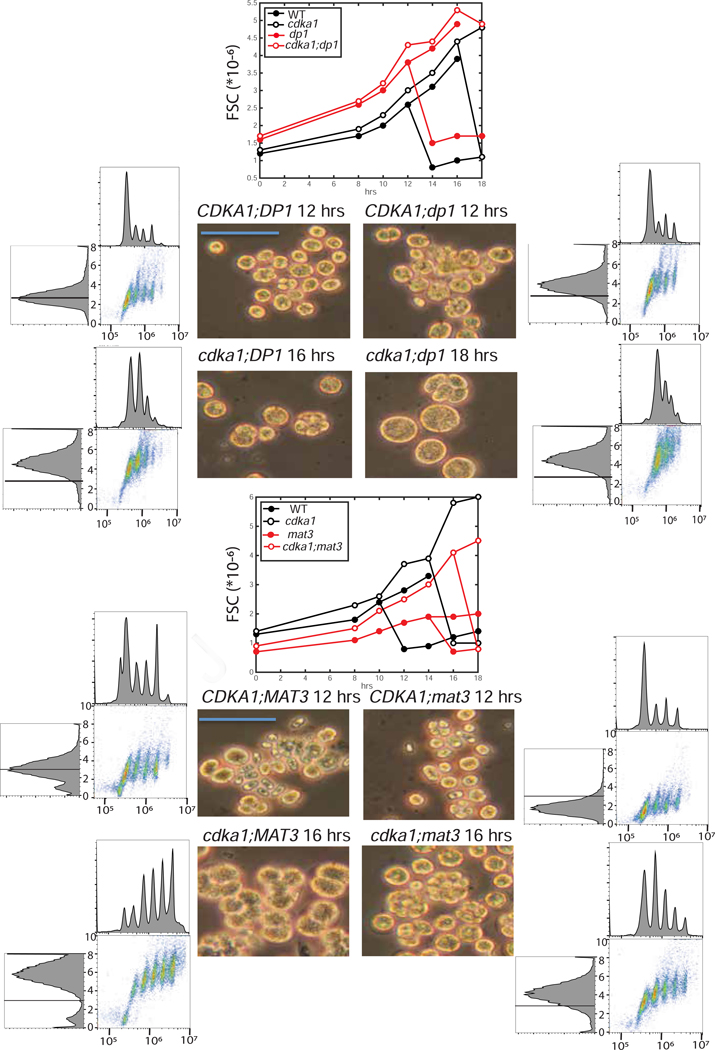
Figure 5. Synchronization of cdka1, mat3, dp1 mutants.
Single, double and triple mutants between cdka1, mat3 and dp1 were synchronized (FACS analysis in Figures 1,S1). Approximate modal FSC values were estimated and plotted for two experiments (center line graphs). Graph bifurcation is from appearance of a newborn daughter cluster. Brightfield images and flow cytometry profiles at an early timepoint with significant DNA replication (Figures 1,S1) are shown. Blue bars: 50 microns. Top: cdka1 x dp1 (experiment 1); bottom: cdka1 x mat3 (experiment 2). WT peak is marked on all FSC histograms (left). Key size values for the three experiments are reported in Table S1. Table S3 contains daughter cell sizes prepared by a different protocol for comparison.

