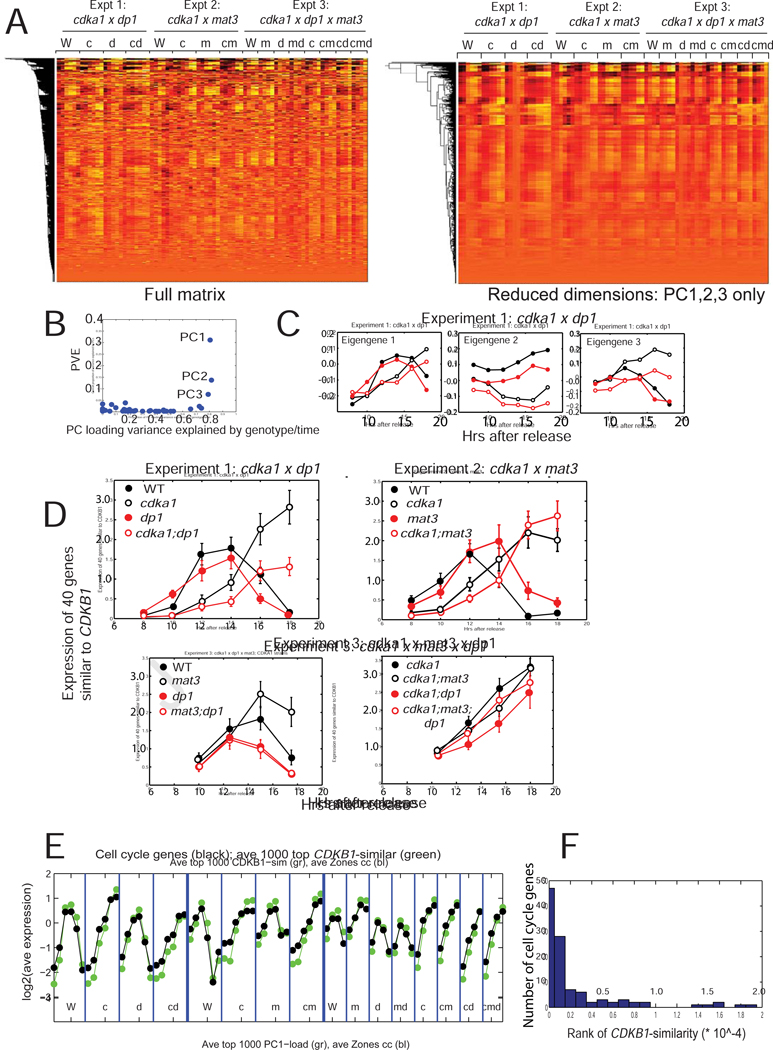
Figure 6. Transcriptomics.
RNA was extracted from synchronous cultures (Figures 1, S1, 5), sequenced and aligned. A. Left: Clustergram of the log2-transformed read-count matrix. Genotype abbreviations: W: WT; c: cdka1; m: mat3; d: dp1; multiple mutants indicated by multiple letters. Right: clustergram of the dimension-reduced matrix (only PC1–3). B. Proportion of overall variance explained against proportion of variation in loadings due to reproducible differences between genotypes/timepoints. C. Loadings for PCs1–3 were separated out for experiment 1. D. Pattern of expression of the mitotic regulon. The 40 genes closest to CDKB1 (canonical regulon member [16][11]) in the log2-transformed matrix were extracted; mean and standard deviation of their expression in the three experiments is shown. Note similarity of eigengene 1 (Figure 6B) to this pattern. Figure S3 presents additional statistical analysis. E. From ref. [16],108 curated cell-cycle-specific genes, most of which show strong periodic expression, were extracted, averaged and plotted together with the 1000 genes most similar to CDKB1 across the experiments. F: Histogram of the rank order of the 108 cell cycle genes for CDKB1 similarity. The random expectation is for flat representation across the range, so the clustering to low ranks demonstrates very strong over-representation of cell-cycle-annotated genes. Similar results were obtained indexing by loading of eigengene 1 (data not shown). Figure S3 contains supporting statistical analysis. Raw readcount data in supplemental Data S1.

