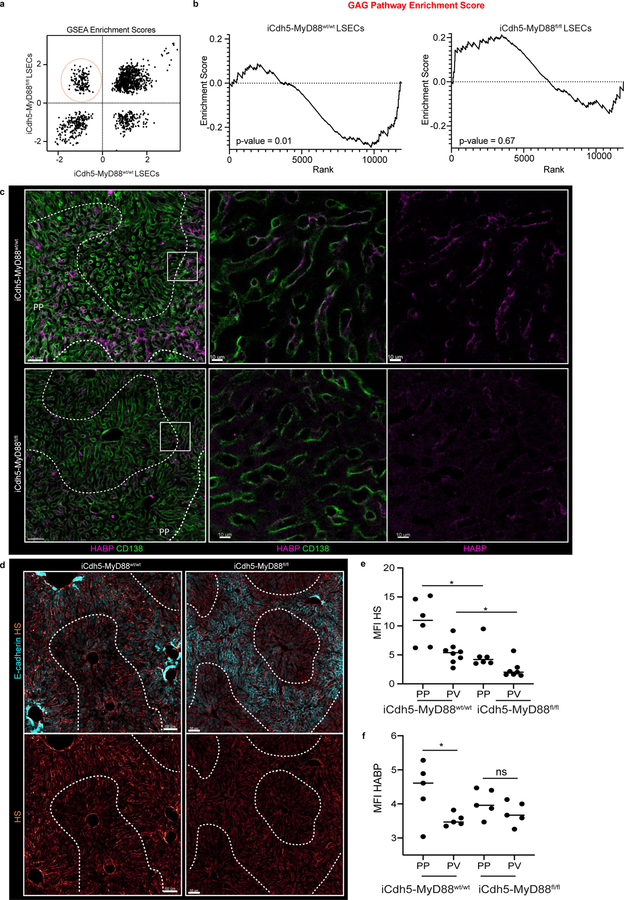
Extended Figure 7. RNAseq GAG pathway and histological ECM composition.
(a) GSEA Enrichment scores in relation to CD117 expression in LSECs from iCdh5-MyD88wt/wt (x-axis) and iCdh5-MyD88fl/fl (y-axis). Highlighted, pathways enriched towards the PP regions of iCdh5-MyD88wt/wt disrupted in iCdh5-MyD88fl/fl animals (Top 10 pathways shown in Fig. 3k). (b) GAG pathway enrichment score in iCdh5-MyD88wt/wt and iCdh5-MyD88fl/fl. iCdh5-MyD88wt/wt show strong PP GAG enrichment, lost and/or disrupted in iCdh5-MyD88fl/fl animals. (c) Representative IF image of Hyaluronic acid binding protein (HABP) detecting Hyaluronic acid (HA) in iCdh5-MyD88wt/wt and iCdh5-MyD88fl/fl. (d) Representative IF image of HS in iCdh5-MyD88wt/wt and iCdh5-MyD88fl/fl. (e-f) MFI of HS and HABP (respectively) in PP and CV ROIs of iCdh5-MyD88wt/wt and iCdh5-MyD88fl/fl animals, each dot represents an ROI; n=4 iCdh5-MyD88wt/wt mice and n= 5 iCdh5-MyD88fl/fl animals, Two-Way ANOVA with Sidak multiple comparison test; Median shown. (e) **p =0.0011, ns p-value-value= 0.0654. (f) *p =0.0348, ns p-value-value= 0.5972. Channels shown labelled in figures.

