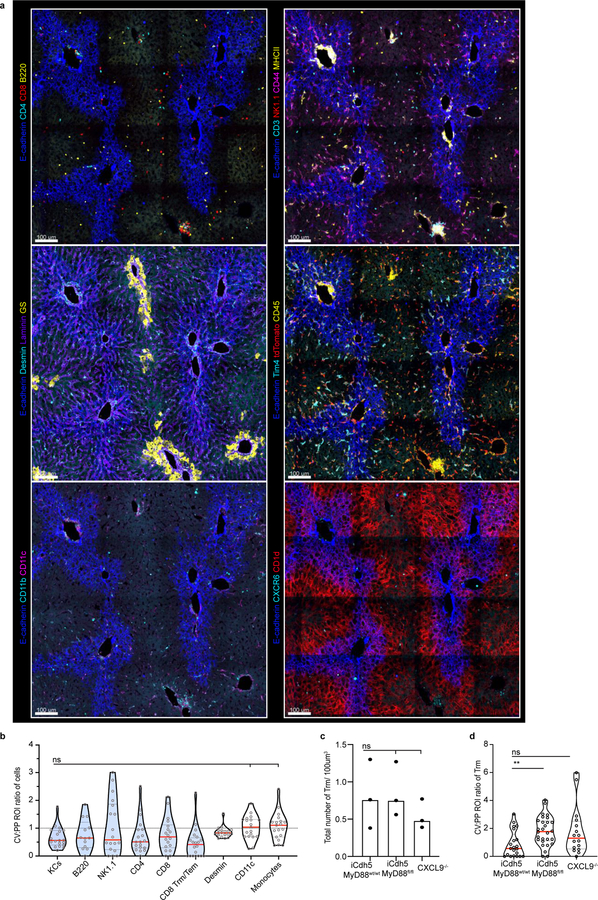
Extended Figure 10. Multi-parameter, iterative staining (IBEX) of Prime and Target vaccinated animals.
(a) Representative IF image of Prime and Target vaccinated animal showing expression of a diverse set of immune and non-parenchymal associated markers in relationship to E-cadherin acquired via IBEX staining (Channels shown labelled in figures). (b) Ratio of total cell numbers in CV to PP ROIs, each dot represents a lobule (each dot represents a lobule); n = 3 mice/condition, Kruskal-Wallis test, Dunn’s multiple comparison test; Median shown. KC vs Desmin: ns p-value=0.3071, KC vs CD11c: ns p-value= 0.0549, KC vs Monocytes: ns p-value=0.0510. (c) Total number of Trm (CD8+ CD44+ CXCR6+ CD69+ T-cells) per volume in iCdh5-MyD88wt/wt, iCdh5-MyD88fl/fl and CXCL9−/− animals (each dot represents a biological replicate). n = 3 mice/condition; Kruskal-Wallis test, Dunn’s multiple comparison test; Median shown, ns p-value>0.9999. (d) Ratio of Trm numbers in CV to PP ROIs, each dot represents a lobule. n = 3 mice/condition; Median shown, Kruskal-Wallis test, Dunn’s multiple comparison test, **p= 0.0035, ns p-value=0.1275.

