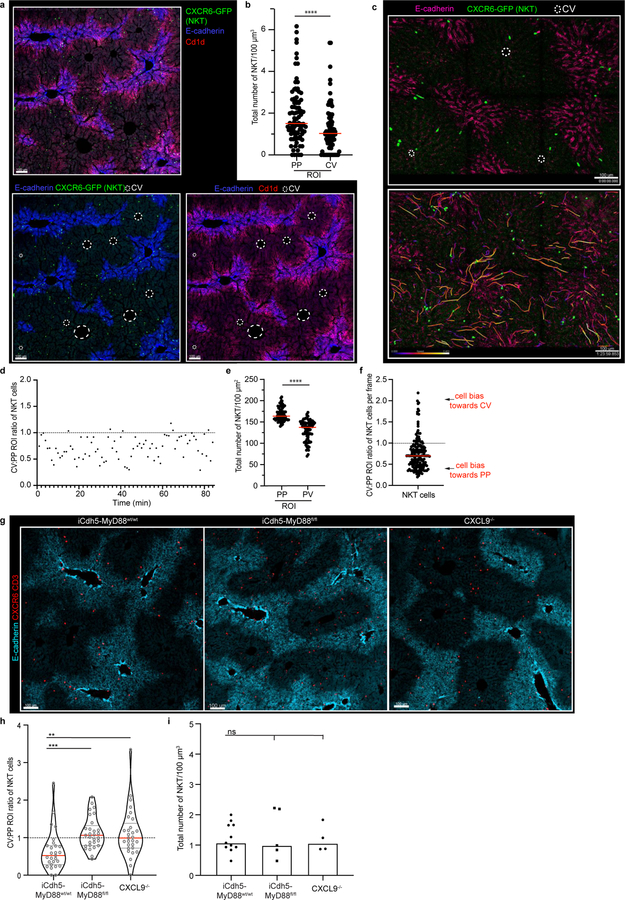
Extended Figure 2. NKT cells show peri-portal enrichment, and are disrupted in iCdh5-MyD88−/− and CXCL9−/− animals.
(a) Representative IF image with CXCR6-GFP (NKT), E-cadherin, and CD1d, CV highlighted by dashed circles in IF images. (b) Total number of NKT cells in PP and CV regions normalized to volume, each dot represents an ROI. n = 4 mice, Two-tailed Mann-Whitney, **** p<0.0001; Median shown. (c) Representative image from 2P-intravital movie of CXCR6-GFP animal showing E-Cadherin antibody injected intravenously i.v. and NKT cell positioning at time zero; Bottom: compiled NKT cell tracks. (d) Representative ratio of total NKT cell numbers in CV to PP ROIs per frame over time. (e) Total number of NKT cells in PP and CV regions normalized to volume for 2-P intravital movies, each dot represents an ROI. n = 3 mice, Two-tailed Mann-Whitney, **** p<0.0001; Median shown. (f) Ratio of total NKT cell numbers in CV to PP ROIs for 2-P intravital movies, each dot represents a frame. n = 3 mice. (g) Representative IF image CXCR6+ CD3+ cells (NKT cells), and E-cadherin in iCdh5-MyD88wt/wt, iCdh5-MyD88fl/fl and CXCL9−/− animals. (h) Ratio of total NKT cells in PP and CV regions normalized to volume, and (i) total number of cells per volume; each dot represents a lobule. n = 4 mice/condition, Kruskal-Wallis test, Dunn’s multiple comparison test, ***p= 0.0002, **p= 0.0013, ns (not significant) p>0.9999; Median and quartile range shown. Channels and CV as labelled in image.

