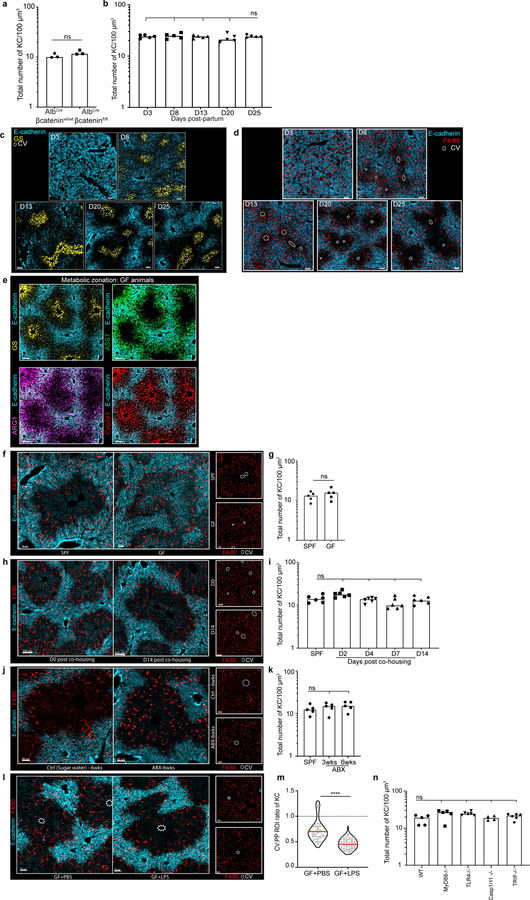
Extended Figure 3. IF images and total numbers of KCs in animals with distinct commensal microbiomes.
(a) Total number of KCs normalized to volume in AlbCre-βcateninwt/wt and AlbCre-βcateninfl/fl animals, eat dot represent a biological replicate, n = 3 mice/condition, Two-tailed Mann-Whitney test, ns p-value= 0.400; Median shown. (b) Representative IF images of mouse livers at days (D) 3, 8, 13, 20, and 25 post-partum. At D3, GS synthetase expression is absent and E-cadherin is homogenously expressed throughout the liver lobule; by D8 both molecules show zonation. (c) Same representative IF images of mouse livers at days (D) 3, 8, 13, 20, and 25 post-partum showing E-cadherin and F4/80+ KCs (for quantification, see Fig 1h). (d) Total number of KCs normalized to volume at days (D) 3, 8, 13, 20, and 25 post-partum, eat dot represent a biological replicate, n = 5 mice/time point. Kruskal-Wallis test with Dunn’s multiple comparison: For D25 vs D3/D8/D13: ns p-value> 0.9999, for D25 vs D20: ns p-value=0.8492; Median shown. Channels and CV as labelled in image. (e) Representative IF image showing normal germ-free animal liver lobule metabolic zonation depicting glutamine synthetase (GS), arginase 1 (ARG1), argininosuccinate synthase 1 (ASS1) and Cytochrome P450 2E (Cyp2e1) expression, for comparison: see SPF zonation gradients in Fig. 1b. (f-k) Representative IF images showing F4/80+ KC distribution within mouse liver (insets showing F4/80+ staining only) and total number of KCs normalized to volume in (f-g) GF and SPF animals (each dot present a biological replicate), n = 5 mice/condition; Two-Tailed Mann-Whitney test, ns p-value= 0.5159, Median shown; (h-i) GF animals after cohousing with SPF animals (each dot present a biological replicate), n = 6 mice/condition, Kruskal-Wallis test with Dunn’s multiple comparison. For SPF vs D4/D14: ns p-value>0.9999, for SPF vs D2 ns p-value=0.2650, for SPF vs D7 ns p-value=0.5255; Median shown. (j-k) SPF animals after antibiotic (ABX) treatment, (each dot presents a biological replicate), n = 6 mice/condition, Kruskal-Wallis test with Dunn’s multiple comparison. For SPF vs 3-wks: ns p-value=0.8725, for SPF vs 6-wks: ns p-value=0.2936; Median shown. (l) Representative IF image showing F4/80+ KC distribution of GF animals orally gavaged with LPS (two weeks post treatment), and PBS control animals (insets showing F4/80 staining only, CV highlighted by dashed circles in IFs). (m) Ratio of total KC numbers in CV to PP ROIs, each dot represents a lobule. n = 6 mice/condition, Two-tailed Mann-Whitney test, **** p<0.0001; Median and quartiles shown. (n) Total number of KCs normalized to volume in global knock-outs for MyD88, TRL4, TRIF and Caspase1/11 (each dot presents a biological replicate), n = 4 Caspase 1/11−/− mice, n= 5 MyD88−/− and WT mice, n= 6 TLR4−/− and TRIF−/− animals, Kruskal-Wallis test with Dunn’s multiple comparison test. For WT vs TRIF−/−/Caspase 1/11−/−: ns p-value>0.9999, for WT vs MyD88−/−: ns p-value=0.0776, WT vs TLR4−/−: ns p-value=0.0524; Median shown. Channels shown labelled in figures, CV highlighted by dashed circles in IFs.

