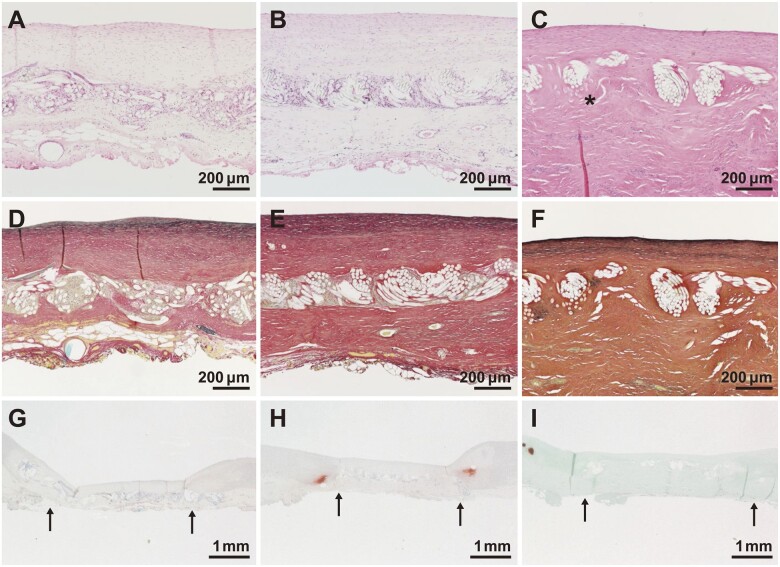
Figure 3:
Changes over time in representative histological images. (A–C) Haematoxylin and eosin staining. Asterisks (*) indicate poly-l-lactic acid fibres. (D–F) Elastica van Gieson staining. (G–I) Alizarin red staining. Arrows (→) indicate the suturing border. (I) Counterstained with light green. (A, D, G) 12 months, (B, E, H) 24 months, and (C, F, I) 36 months after implantation.

