FIGURE 5.
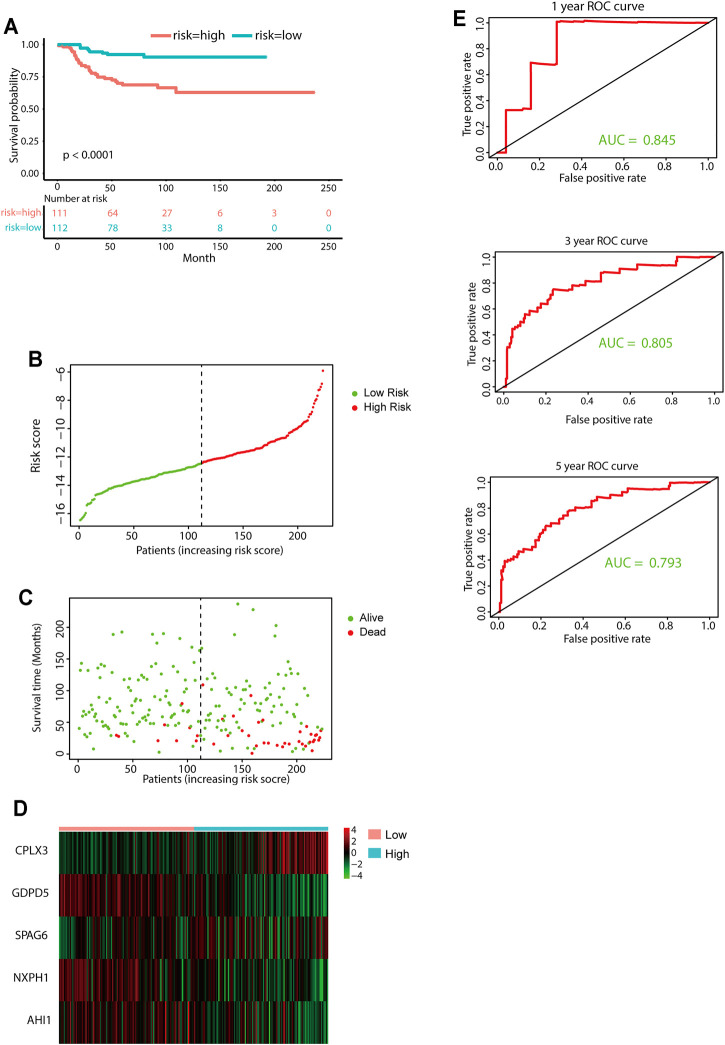
External validation of the five-gene signature. (A) KM curves for overall survival of the two risk groups derived from the five-gene signature in the E-MTAB-8248 data set. The p-value was calculated by the log-rank test. (B-D) Distribution of the risk score (B), the associated survival data (C), and the five-gene mRNA expression (D) in the E-MTAB-8248 data set. (E) ROC curves for 1-year, 3-year, and 5-year overall survival predictions for the five-gene signature in the E-MTAB-8248 data set.

