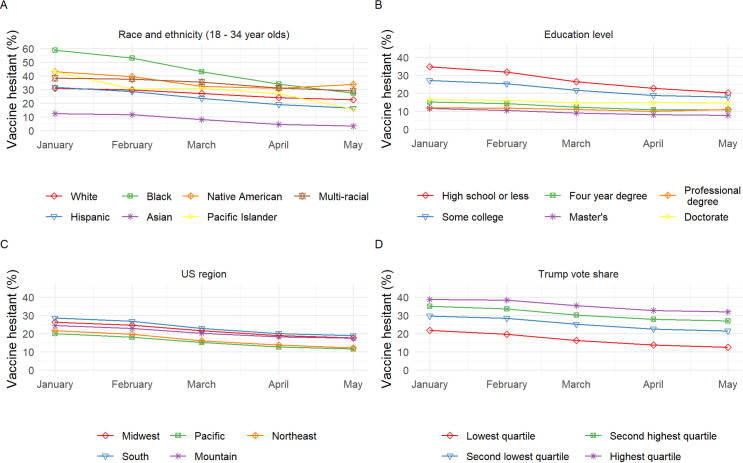
Fig 2. COVID-19 vaccine hesitancy by race/ethnicity (ages 18–34 yearsa), education level, US region and county Trump vote share in the 2020 presidential election among US adults by month (January-May, 2021).
Between January and May, the gap in percent hesitant between race/ethnicity groups among adults 18–34 years (panel A) and education levels among all ages (panel B) decreased, with the biggest decreases among the most hesitant groups (e.g., Black race and ≤high school education, respectively). Changes in percent hesitant over time were fairly similar across US regions (panel C); however, there was a slightly smaller decrease in the Mountain region and slightly larger decrease in the South versus other regions. The gap in percent hesitant by county political environment, quantified in quartiles of percent Trump vote share in the 2020 presidential election, increased slightly between January and May, with the most hesitant group (highest quartile) having the smallest decrease (panel D). a There was a significant interaction between race/ethnicity group and age group. Vaccine hesitancy for all race/ethnicity groups by all age groups is provided in S6 Table.

