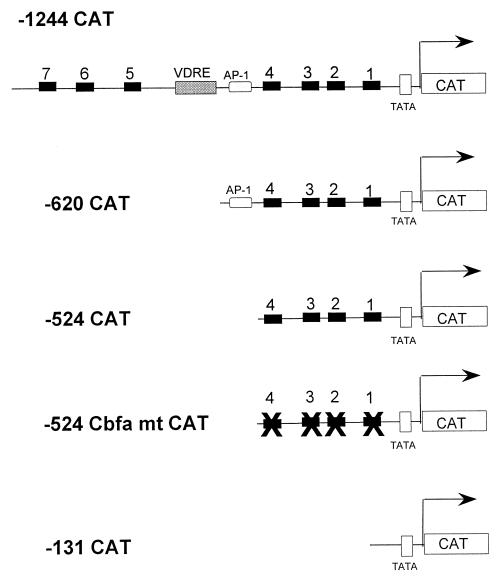
TABLE 1.
Summary of repressor effects of Cbfa factors on various segments of the Gallus BSP promoter
| Construct | Mean CAT activity ± SEMa
|
Cell line | |||
|---|---|---|---|---|---|
| Cbfa1 MASN | Cbfa1 MRIPV | Cbfa2 | Cbfa3 | ||
 |
2.1 ± 0.2 | 1.7 ± 0.2 | 2.7 ± 0.3 | 4.7 ± 0.2 | HeLa |
| 3.4 ± 0.4 | 2.4 ± 0.3 | 3.8 ± 0.4 | 5.8 ± 0.6 | ROS 17/2.8 | |
| 6.8 ± 0.8 | 4.0 ± 0.5 | 7.9 ± 1.0 | 11.0 ± 1.5 | HeLa | |
| 7.4 ± 1.2 | 4.9 ± 0.5 | 10.4 ± 1.1 | 14.3 ± 1.3 | ROS 17/2.8 | |
| 6.9 ± 0.8 | 3.9 ± 0.6 | 9.9 ± 1.1 | 13.2 ± 1.7 | HeLa | |
| 8.4 ± 1.3 | 5.5 ± 0.7 | 10.8 ± 1.9 | 16.0 ± 2.4 | ROS 17/2.8 | |
| 1.0 ± 0.1 | 1.6 ± 0.3 | 1.6 ± 0.2 | 1.3 ± 0.2 | HeLa | |
| 1.0 ± 0.1 | 1.3 ± 0.1 | 1.5 ± 0.1 | 1.7 ± 0.3 | ROS 17/2.8 | |
| 1.0 ± 0.1 | 1.2 ± 0.2 | 1.2 ± 0.2 | 1.0 ± 0.2 | HeLa | |
| 1.2 ± 0.1 | 1.1 ± 0.1 | 1.4 ± 0.2 | 1.1 ± 0.1 | ROS 17/2.8 | |
Values shown are normalized CAT activity expressed as fold suppression. n = 18 samples per group for each cell line.
