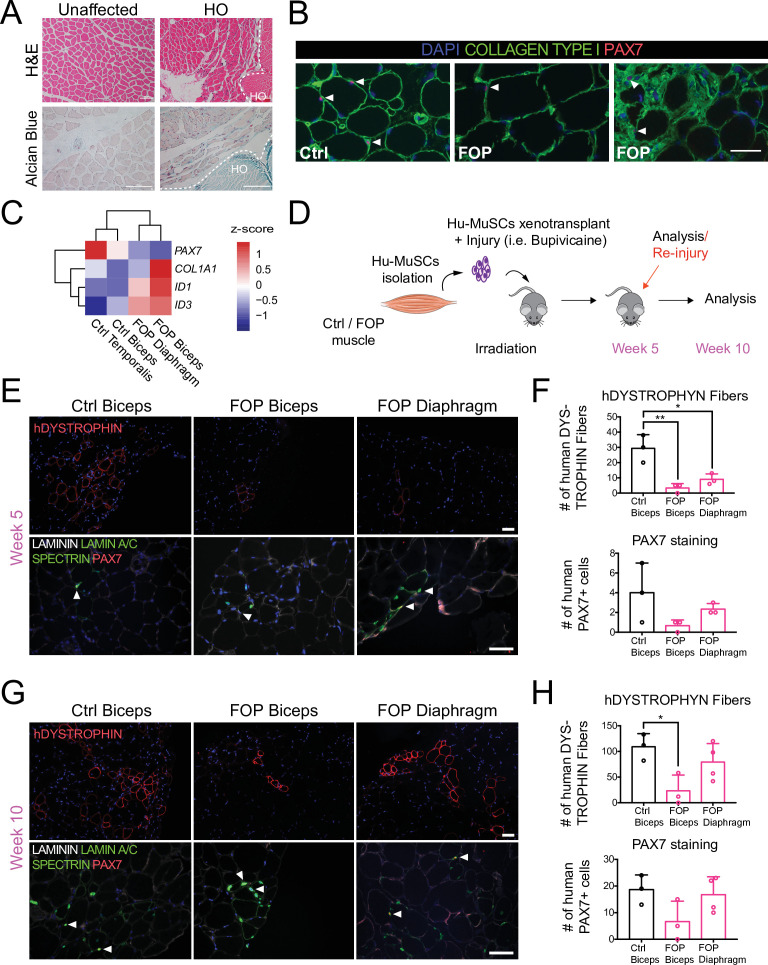
Figure 1. Regenerative properties of primary Hu-MuSCs isolated from FOP patients.
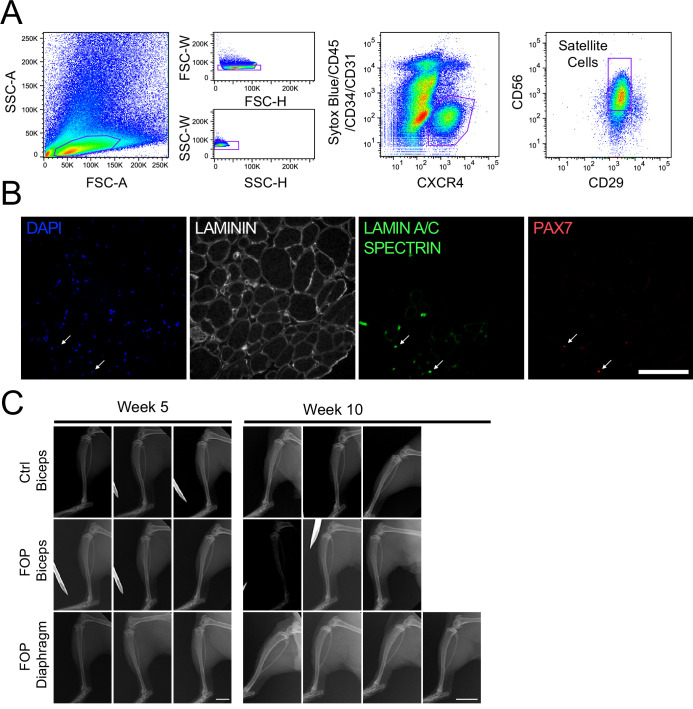
(A) Hematoxylin and eosin staining (top) and alcian blue staining (bottom) of muscle cross sections from FOP subjects, with no heterotopic ossification (left) and with heterotopic ossification, depicted by the white dashed line (right, 100 µm scale bar). (B) Immunofluorescence staining for PAX7 and COL1 of muscle cross sections from control and FOP subjects. White arrowheads mark Hu-MuSCs, 50 µm scale bar. (C) Heat map of normalized gene expression of sorted human satellite cells from two control subjects and two different muscles of 1 FOP subject. (D) Schematic and experimental time course. Hu-MuSCs from biceps and diaphragm muscles of a deceased FOP patient were sorted and transplanted into NSG mice. (E) Immunofluorescence staining 5 weeks after xenotransplantation. White arrowheads mark Hu-MuSCs, 50 µm scale bar. (F) Quantification of human DYSTROPHIN fibers and human PAX7+ cells 5 weeks after transplant. (G) Mice were re-injured 5 weeks after transplantation with bupivacaine. Immunofluorescence staining was performed at week 10. White arrows mark Hu-MuSCs, 50 µm scale bar. (H) Quantification of human DYSTROPHIN fibers and human PAX7+ cells after re-injury at week 10. n = 1, biological replicates, n ≥ 3 technical replicates. Error bars represent mean and SD. *, p < 0.05, **, p < 0.01. Muscle specimen and transplantation details are listed in Figure 1—source data 1 and Figure 1—source data 2 .


