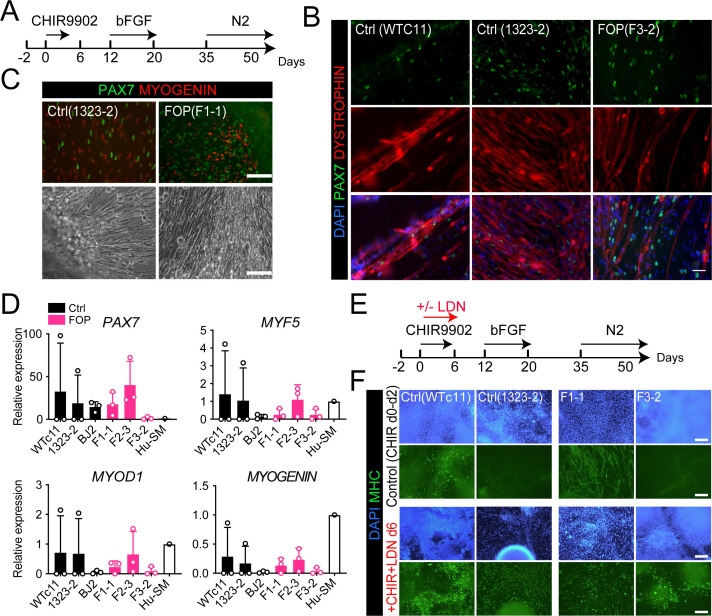
Figure 2. Skeletal muscle differentiation of human control and FOP hiPSC lines.
(A) Differentiation schematic of hiPSCs into skeletal muscle stem cell-like cells (iMPCs). (B) Immunofluorescence staining for PAX7, DYSTROPHIN and nuclear stain DAPI of iMPCs at day 50, 50 µm scale bar. (C) Immunofluorescence staining of PAX7 and MYOGENIN expressing cells. Control and FOP hiPSCs can form contractile myotubes, 100 µm scale bar. (D) PAX7, MYF5, MYOD1, and MYOGENIN gene expression at day 50 of differentiation (n = 3 biological replicates and n ≥ 3 technical replicates). Error bars represent mean ± SD. No statistically significant differences were detected. (E) Schematic describing the addition of the BMP pathway inhibitor LDN193189 (LDN). (F) Representative immunofluorescence staining of 2 control and 2 FOP hiPSC lines differentiated and stained for MHC (Myosin Heavy Chain) and nuclear stain DAPI at day 50±LDN addition, 200 µm scale bar.


