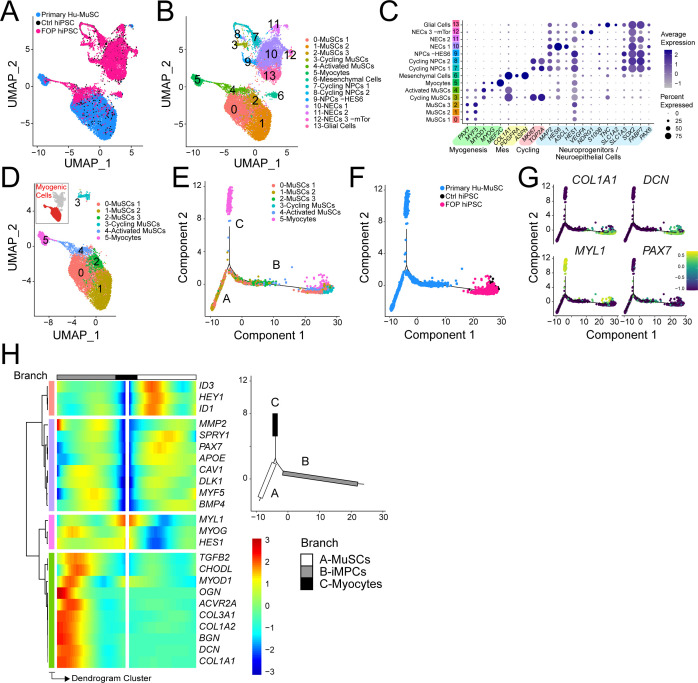
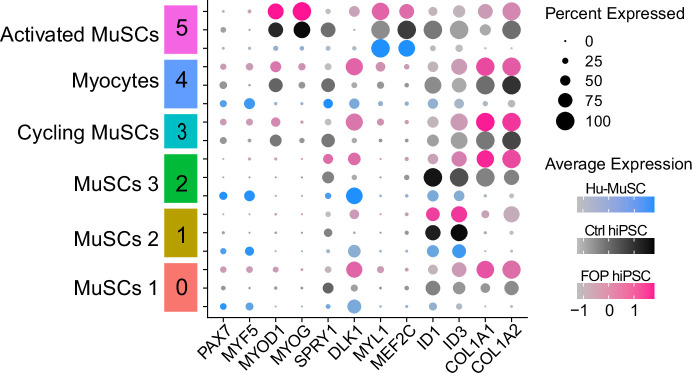
Figure 6. iMPC transcriptional signature compared to human primary muscle stem cells.
(A–B) UMAP of cells combined from human primary muscle stem cells (vastus muscle) and the control and FOP samples. (A) UMAP showing the distribution of cells per sample, and (B) with clusters labeled. (C) Dot plot displaying expression of cluster defining genes. (D) Myogenic cells (in red) are comprised in cluster 0–5. UMAP of the myogenic clusters. (E–G) Pseudotime trajectory plot generated via Monocle analysis depicting all myogenic clusters (E) and samples (F). (G) Level of expression of ECM/osteogenic genes along the cell trajectories. (H) Heatmap representing genes that are significantly branch dependent using the BEAM analysis (Figure 6—source data 1) and also genes that have similar lineage-dependent expression patterns. Branches are shown in the upper right panel.


