. 2021 Dec 21;10:e67660. doi: 10.7554/eLife.67660

Figure 3. Classification of live, dead, and apoptotic iPSCs with iSGC.

(A). Scatter plot of PI and Annexin V for iPSCs. The population within the blue, red, and orange regions were labeled as live, dead, and apoptotic cells, respectively. (B). Scatter plot of FSC and BSC for iPSCs without exclusion of debris and doublets. (C). Scatter plot of FSC and BSC for each labeled iPSC populations. The blue, red, and orange dots each correspond to live, dead, and apoptotic cells, respectively. All populations, which are previously shown in (B), are gated prior to labeling for removing debris and doublets (Figure 3—figure supplement 1A and Figure 3—figure supplement 2). In the plot, the live and dead populations have distinct separation, but the live and apoptotic populations overlap. (D–F) SVM score histograms for the iSGC-based classification of dead cells from live cells (D), apoptotic cells from live cells (E), and apoptotic cells from live cells within the red region in the scatter plot (B, F). The colors correspond to the labels in (A). All histograms are the best result of 10 times random sampling. The AUCs for each classification were 0.999 (D), 0.885 (E), and 0.904 (F). The mean and standard deviation of AUCs for the 10 trials in each condition were 0.998±0.002, 0.877±0.007, and 0.891±0.012, respectively (Figure 3—figure supplement 1, D, E, and F). BSC, back scatter; FSC, forward scatter; iPSC, induced pluripotent stem cell; iSGC, in silico-labeled ghost cytometry; PI, propidium iodide; SVM, support vector machine.

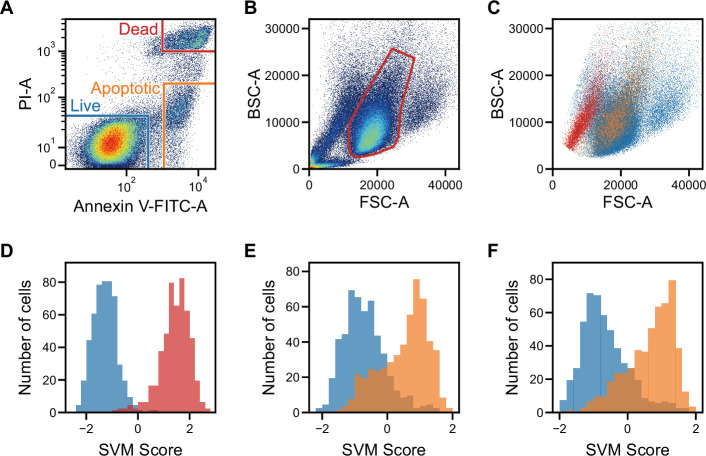
Figure 3.

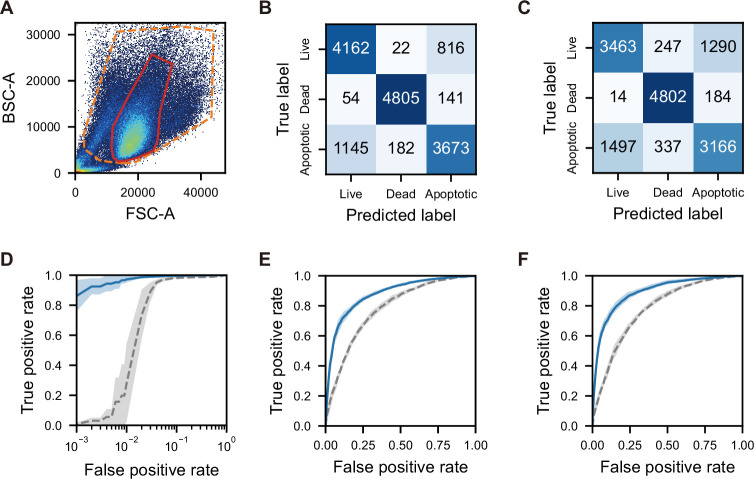
Figure 3—figure supplement 1. Scatter plot, confusion matrices, and SVM score histograms for the classification of live, dead, and apoptotic cells using iPSCs with iSGC.

Figure 3—figure supplement 1.

(A) Scatter plot of FSC and BSC intensities. Orange dashed line corresponds to the region used to label the cells in Figure 3A. Red solid line is the same region as the red line in Figure 3B. (B, C) Confusion matrices for the SVM-based classification of live, dead and apoptotic cells using dGMI and ssGMI (B) and FSC and SSC (C), derived by the sum of all trials from 10 times random sampling. The macro-average F1-scores were 0.842±0.006 (B) and 0.759±0.006 (C). (D–F). ROC curves for the classification of live versus dead cells (D), live versus apoptotic cells (E), and live versus apoptotic cells within the region of red line in (A). (F) Blue solid lines correspond to the SVM-based classification with dGMI and bsGMI, and gray dashed lines correspond to the SVM-based classification with FSC and BSC. Each line represents the mean, and the shaded area around each line represents the standard deviation for 10 trials. The AUCs of the blue solid line and the gray dashed line are 0.997±0.002 and 0.974±0.007, respectively, in (D), 0.878±0.007 and 0.779±0.011, respectively, in (E), and 0.892±0.012 and 0.777±0.012, respectively, in (F). BSC, back scatter; bsGMI, XXX; dGMI, diffractive ghost motion imaging; FSC, forward scatter; iPSC, induced pluripotent stem cell; iSGC, in silico-labeled ghost cytometry; ROC, receiver operating characteristic; ssGMI, XXX; SVM, support vector machine.
Figure 3—figure supplement 2. Gating for the iSGC analysis in the classification of live, dead, and apoptotic iPSCs.

Figure 3—figure supplement 2.

FSC/BSC (left panel) and FSC height/width (middle panel) scatter plots used for removing debris and doublets, and fluorescence scatter plot of Annexin V-FITC and PI (right panel) for labeling live (blue), dead (red), and apoptotic (green) cells. The region in the red line is the same region as the red line in Figure 3B and Figure 3—figure supplement 1. BSC, back scatter; FSC, forward scatter; iSGC, in silico-labeled ghost cytometry; iPSC, induced pluripotent stem cell; PI, propidium iodide.