. 2021 Dec 21;10:e67660. doi: 10.7554/eLife.67660

Figure 5. Peripheral WBC differential classification with iSGC.

(A) Flow-cytometry scatter plots used for gating and labeling WBCs. (B, C) Confusion matrix for the classification of peripheral WBCs. The training and classification were performed using a sample from the same donor (intra-donor) for (B) and samples from different donors (inter-donor) for (C). The macro-average F1-scores were 0.911 and 0.904 for (B) and (C), respectively. (D, E) Proportion of each cell type by CD-marker-based labels, iSGC-predicted labels for cells that were gated and given the ground truth labels in (A), and iSGC-predicted labels for all cells including those that were not gated in (A). Similar to (B) and (C), the training and classification were performed in an intra-donor manner for (D) and an inter-donor manner for (E). (F–H). Scatter plot of CD45 and BSC for all WBC. The colors in each plot correspond to CD-marker-based labels (F), iSGC-predicted labels trained, and predicted in an intra-donor manner (G), and iSGC-predicted labels trained and predicted in an inter-donor manner (H). The colors in (G) and (H) correspond to the same labels as (F). BSC, back scatter; iSGC, in silico-labeled ghost cytometry; WBC, white blood cell.

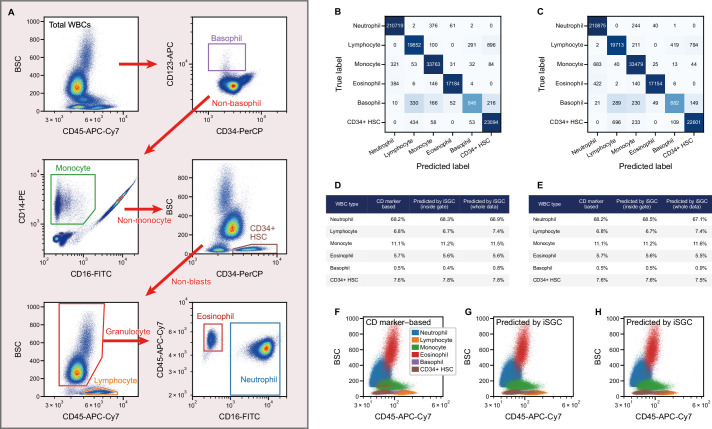
Figure 5.

Figure 5—figure supplement 1. Confusion matrix and proportion of cell types for WBC differential classification performed for a different donor sample.

Figure 5—figure supplement 1.

(A, B) Confusion matrix for the classification of peripheral WBCs performed on the donor blood sample used for training in Figure 5C and E. The training and classification were performed in an intra-donor manner for (A) and in an inter-donor manner for (B). The macro-average F1-scores were 0.907 and 0.890 for (A) and (B), respectively. These values are in close correspondence with those in Figure 5B and C. (C, D) Proportion of each cell type by CD-marker-based labels and iSGC-predicted labels for cells that were gated and given the ground truth labels, and iSGC-predicted labels for all cells including those that were not gated. Similar to (A) and (B), the training and classification were performed in an intra-donor manner for (C) and an inter-donor manner for (D). iSGC, in silico-labeled ghost cytometry; WBC, white blood cell.
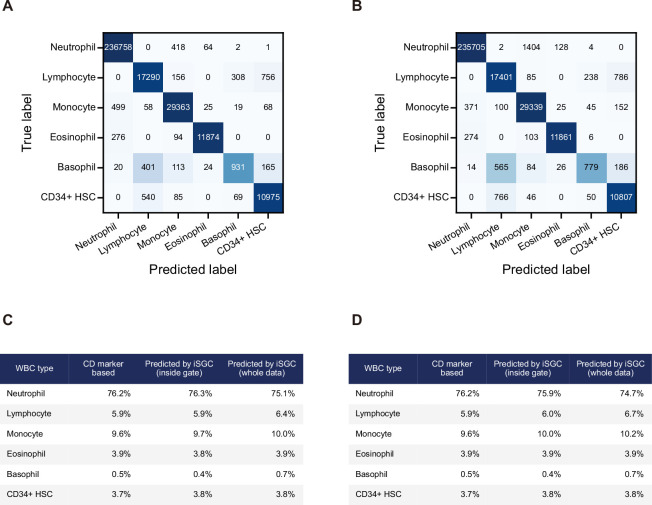
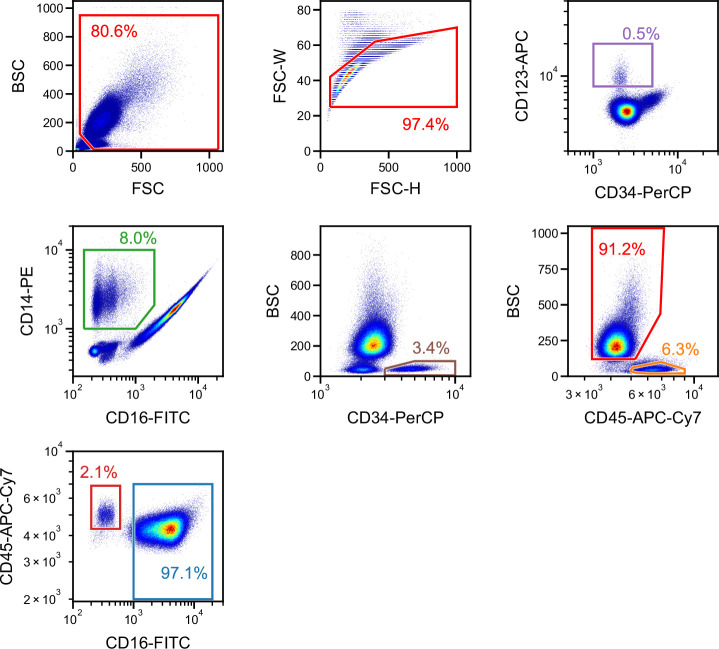
Figure 5—figure supplement 2. Gating for a single run of blood cells obtained from a single donor used for providing the ground truth and performing intra-donor learning for the iSGC analysis in WBC differential classification.

Figure 5—figure supplement 2.

FSC/BSC (top-left panel) and FSC width/height (top-middle panel) scatter plots were used for removing debris and doublets. The rest of the panels correspond to the scatter plots in Figure 5A. First, CD34-PerCP/CD123-APC (top-right panel) was used to gate basophils. The non-basophils were then plotted on a CD16-FITC/CD14-PE scatter plot (second row, left panel) to gate monocytes. The non-monocytes were then plotted on a CD34-PerCP/BSC scatter plot (second row, middle panel) to gate the CD34+ hematopoietic stem cells (HSCs). The non-HSCs were then plotted on a CD45-APC-Cy7-H/BSC scatter plot (second row, right panel) to gate lymphocytes (lower right gate) and granulocytes (upper-left gate). The granulocytes were then plotted on a CD16-FITC/CD45-APC-Cy7-A plot (bottom-left panel) to gate eosinophils (upper-left gate) and neutrophils (lower-right gate). BSC, back scatter; FSC, forward scatter; iSGC, in silico-labeled ghost cytometry; WBC, white blood cell.
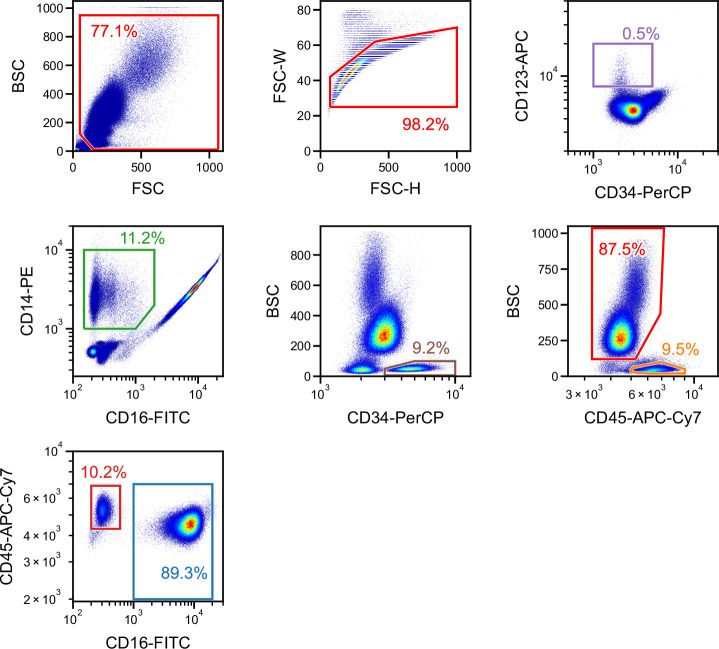
Figure 5—figure supplement 3. Gating for a single run of blood cells obtained from a different donor used for performing inter-donor learning for the iSGC analysis in WBC differential classification.

Figure 5—figure supplement 3.

FSC/BSC (top-left panel) and FSC width/height (top-middle panel) scatter plots were used for removing debris and doublets. The rest of the panels correspond to the scatter plots in Figure 5A. First, CD34-PerCP/CD123-APC (top-right panel) was used to gate basophils. The non-basophils were then plotted on a CD16-FITC/CD14-PE scatter plot (second row, left panel) to gate monocytes. The non-monocytes were then plotted on a CD34-PerCP/BSC scatter plot (second row, middle panel) to gate the CD34+ hematopoietic stem cells (HSCs). The non-HSCs were then plotted on a CD45-APC-Cy7-H/BSC scatter plot (second row, right panel) to gate lymphocytes (lower right gate) and granulocytes (upper-left gate). The granulocytes were then plotted on a CD16-FITC/CD45-APC-Cy7-A plot (bottom-left panel) to gate eosinophils (upper-left gate) and neutrophils (lower-right gate). BSC, back scatter; FSC, forward scatter; iSGC, in silico-labeled ghost cytometry; WBC, white blood cell.