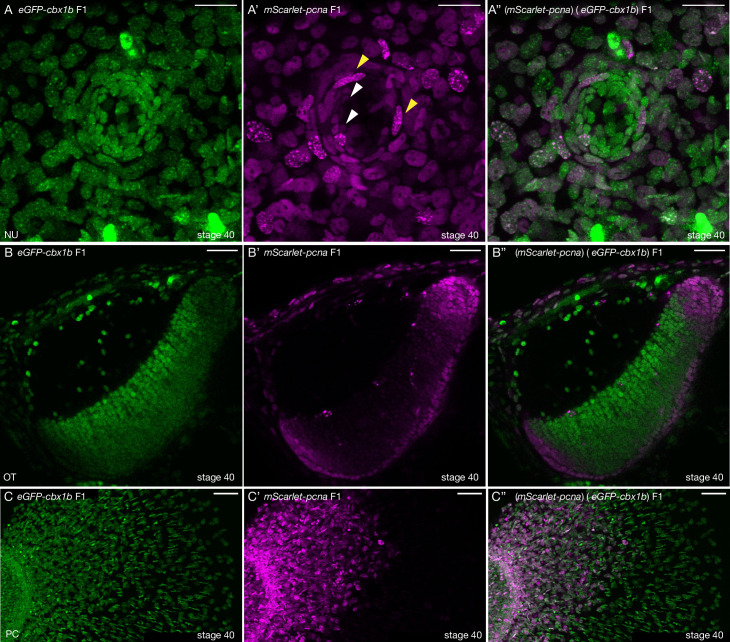
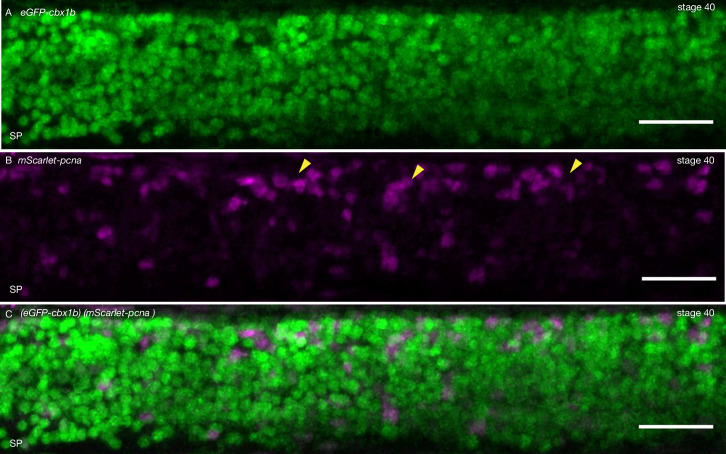
Figure 3. mScarlet-pcna line acts as an organismal-wide marker for proliferative zones.
(A–A’’) (eGFP-cbx1b) (mScarlet-pcna) double positive stage 40 medaka embryo. Maximum projection of a mature secondary neuromast (centre of image) within the lateral line system surrounded by epithelial cells, labelled by: endogenous eGFP-Cbx1b in (A) and endogenous mScarlet-Pcna in (A’). The merge is shown in (A’’). (A) eGFP-Cbx1b is a ubiquitous nuclear marker and labels all cell types within a mature neuromast. Those are: hair cells (HCs) in the centre of a neuromast, surrounded by support cells (SCs), and an outer ring of mantle cells (MCs) surrounded by the elongated neuromast border cells (nBCs). (A’) mScarlet-Pcna labels cycling cells, which are located at the very edge of the mature neuromast organ, a proportion of MCs express mScarlet-Pcna (white arrowheads). nBCs also express mScarlet-Pcna. Speckles can be seen in several mScarlet-Pcna-positive nBC nuclei (yellow arrowheads), indicating cells in late S phase of the cell cycle. (A’’) Merged image. n = 10 neuromast organs. NU = neuromast. Scale bar = 20 µm. (B–B’’) (eGFP-cbx1b) (mScarlet-pcna) stage 40 medaka embryo. Single Z-slice showing the medaka optic tectum. (B) eGFP-Cbx1b is a ubiquitous nuclear marker, (B’) whereas mScarlet-Pcna labels a subset of cells at the outer periphery of the optic tectum, indicating the position of proliferative cells in this tissue. A graded expression of mScarlet-Pcna is observed, with more central cells in the optic tectum losing the expression of mScarlet-Pcna. (B’’) Merged image. n = 4 embryos. OT = optic tectum. Scale bar = 30 µm. (C–C’’) Maximum projection of the pectoral fin of stage 40 medaka embryos. (C) eGFP-Cbx1b is a ubiquitous nuclear marker, (C’) while a subset of cells is labelled by mScarlet-Pcna indicating the position of proliferative cells. Note the proximal to distal gradient of mScarlet-Pcna expression, with proliferative cells at the base of the fin (left) and differentiated cells at the outer edges of the fin (right) (C’’) Merged image. n = 4 embryos. PC = pectoral fin. Scale bar = 50 µm.


