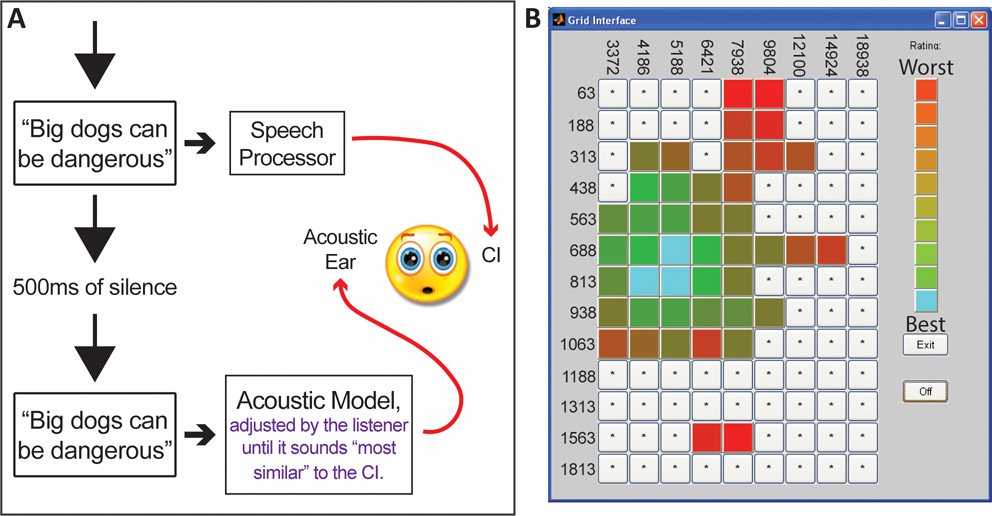
Figure 1:
Figure 1A illustrates the self-selection process. A sentence is first presented to the CI ear via direct audio input. Then the same sentence is processed by an acoustic model and presented to the normal hearing ear. Participants adjusted output noise bands or tones to obtain a “self-selected” acoustic model. The analysis filter bank was fixed and identical to the participant’s clinical map. Figure 1B shows the grid of 117 acoustic models used for acoustic model self-selection by Cochlear™ CI users. Within the grid, the minimum frequency was denoted by the row (ranging from 63 Hz to 1,813 Hz in this case), and the maximum frequency was denoted by the column (ranging from 3,372 Hz to 18,938 Hz). The color rating scale is to the right of the grid, with an example of a participant’s ratings shown throughout the grid. Similar grids were used for MED-EL™ and Advanced Bionics™ CI users.

