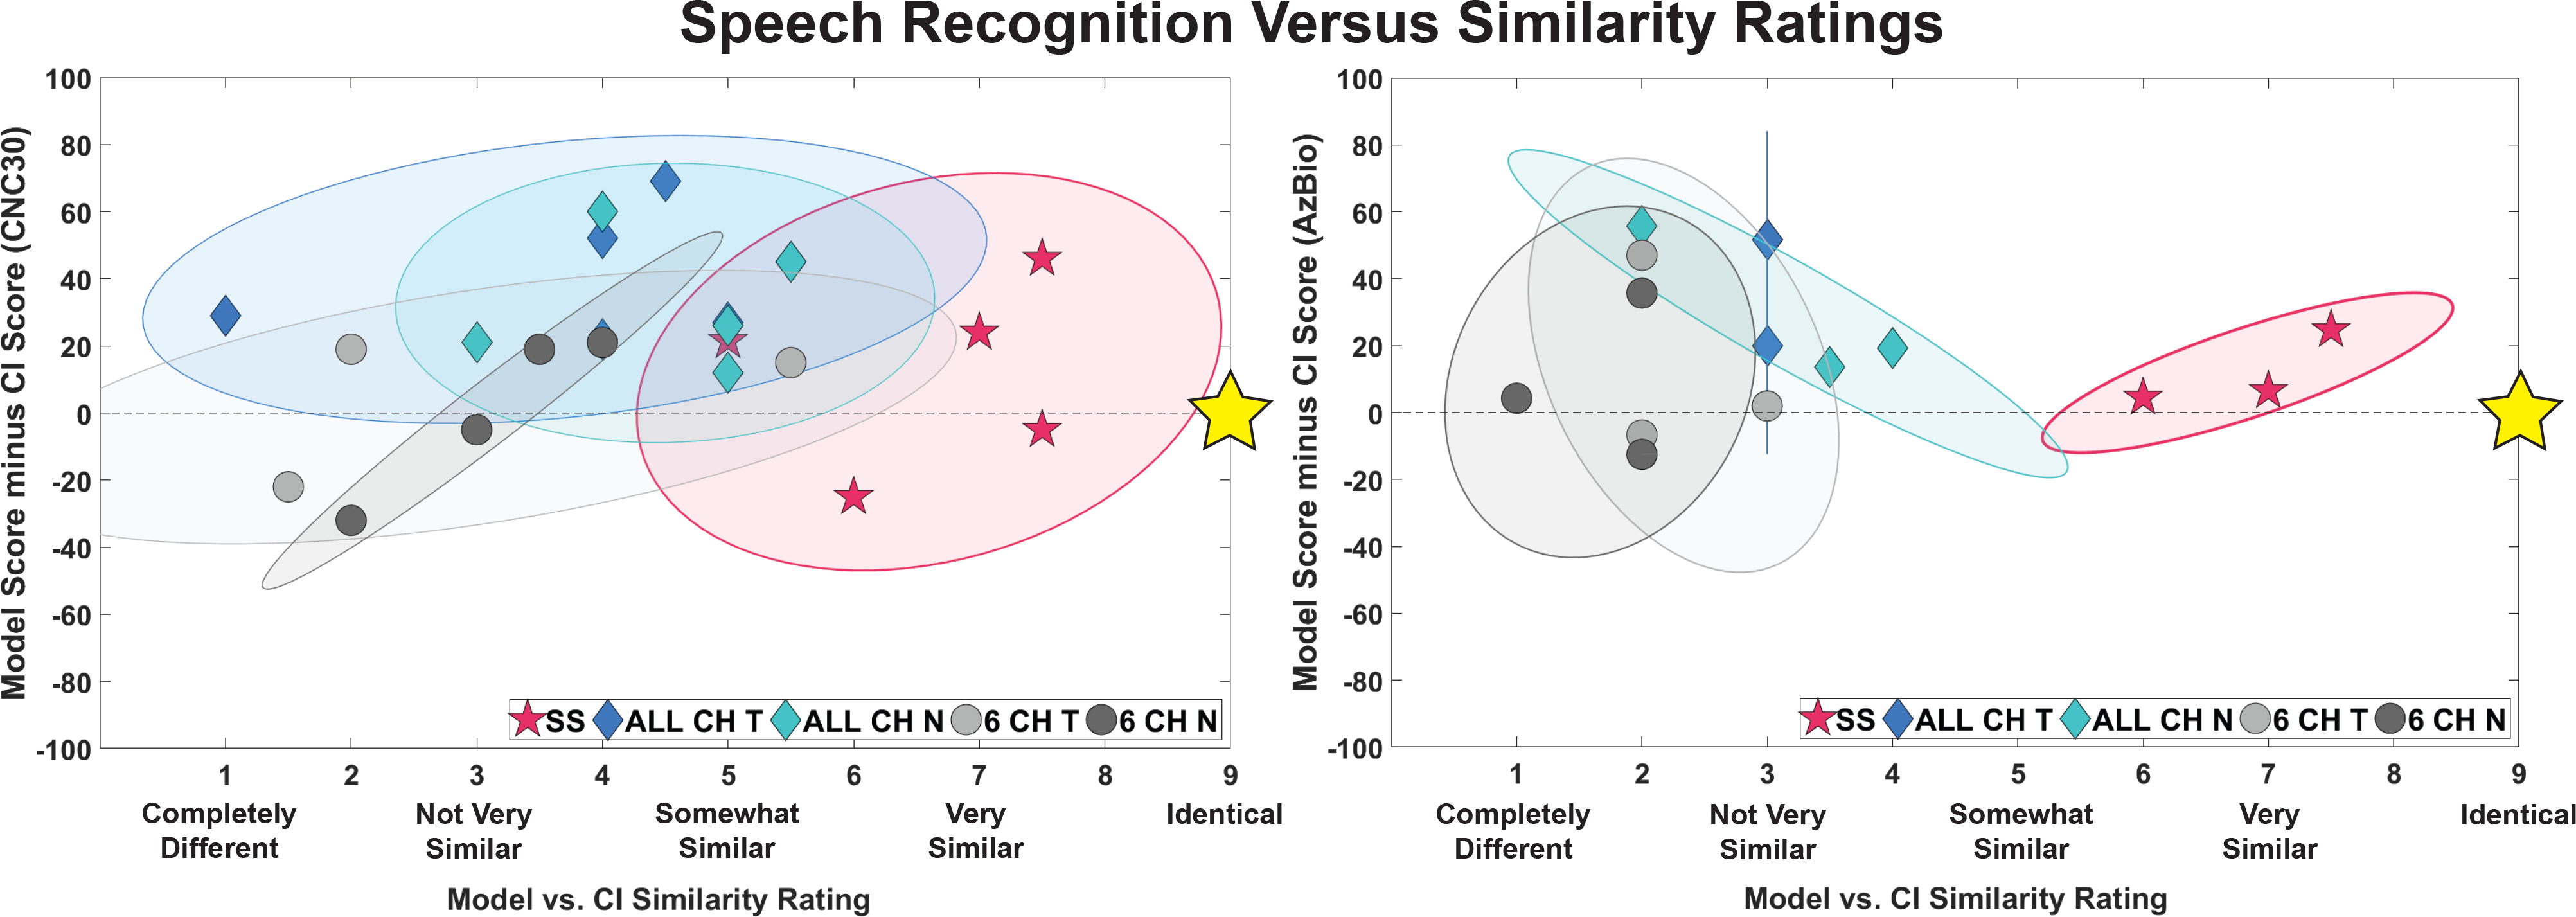
Figure 6:

Scatterplot of overall similarity ratings and speech perception scores for five acoustic model types: self-selected (SS), all channel frequency-matched tone and noise (ALL CH T and ALL CH N), and 6 channel frequency-matched tone and noise (6 CH T and 6 CH N). The x axes show the similarity ratings and the y axes show the difference in the speech scores (acoustic model scores minus CI only scores). Those tested with CNC-30 words (n=5) are shown on the left and those tested with AzBio sentences (n=3) are shown on the right. The gold stars indicate the location of a “perfect” acoustic model: rated as “identical” to the CI and resulting in the same speech perception scores
