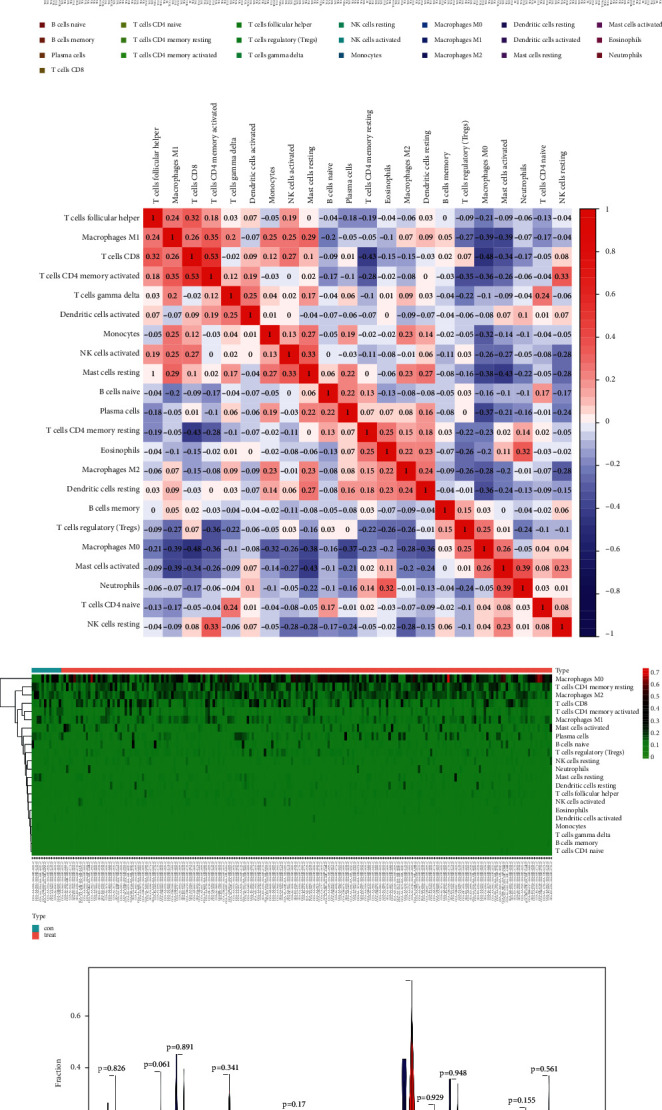
Figure 7.

(a) Composition of immune cells in all samples. (b) The proportion of different immune cells. (c) Heat map of the immune cell components. (d) Comparison of immune cell proportions between tumor (blue) and normal (red) tissues.

(a) Composition of immune cells in all samples. (b) The proportion of different immune cells. (c) Heat map of the immune cell components. (d) Comparison of immune cell proportions between tumor (blue) and normal (red) tissues.