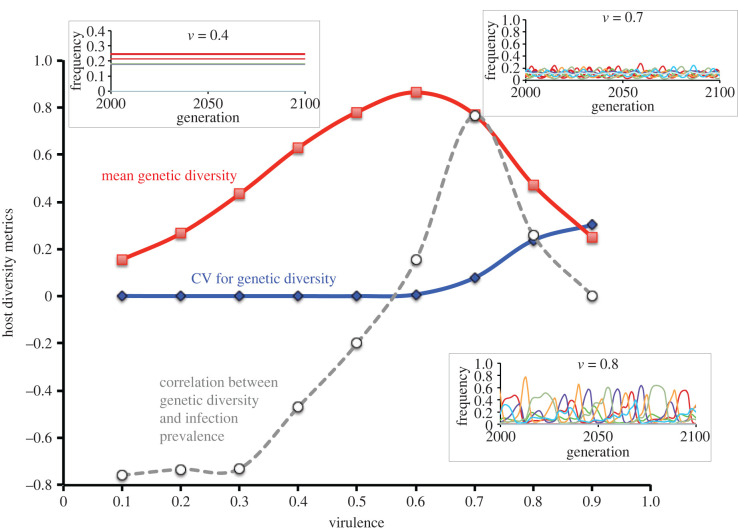
Figure 2.
Cross section through figure 1b and c at parasite fecundity = 15. The lines show the relationships between host genetic diversity (red line), fluctuations in diversity (blue line, the coefficient of variation for host diversity), and the correlation between host genetic diversity and infection prevalence (dashed grey line). Note that the correlation is only positive and high for a small portion of parameter space in which diversity is high. Also, note that the peak correlation corresponds to moderate fluctuations in diversity over time (grey line). Insert, upper left: representative host genotype dynamics for moderate virulence (v = 0.4). The different coloured lines represent different host genotypes. Insert, upper right: representative host genotype dynamics for moderately high virulence (v = 0.7). Insert, lower right: representative host genotype dynamics for high virulence (v = 0.8). Taken together, the results suggest that detection of strong positive correlations would be most likely at moderate-to-high levels of parasite-mediated selection, depending on parasite fecundity (figure 1).

