Figure 6.

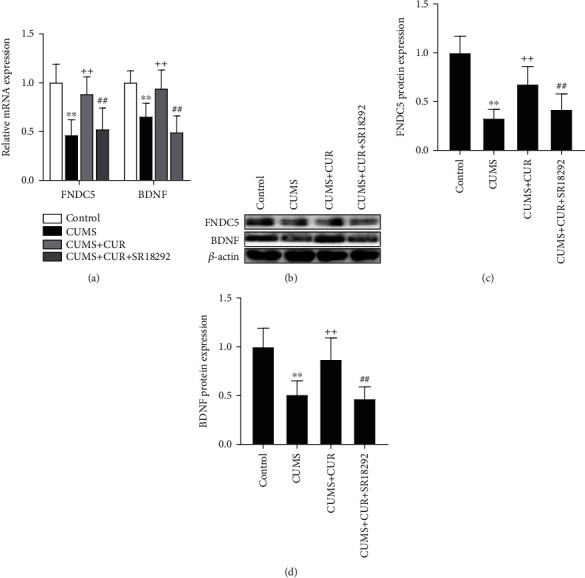
(a) Relative mRNA expressions of FNDC5 and BDNF. (b) Western blot bands indicating the protein expressions of FNDC5 and BDNF. (c) and (d) Protein expressions of FNDC5 and BDNF normalized to that of the β-actin internal control. Data are expressed as means ± SD (n = 7). ∗p < 0.05 and ∗∗p < 0.01 compared to the control group. +p < 0.05 and ++p < 0.01 compared to the CUMS group. #p < 0.05 and ##p < 0.01 compared to the CUMS + CUR group.
