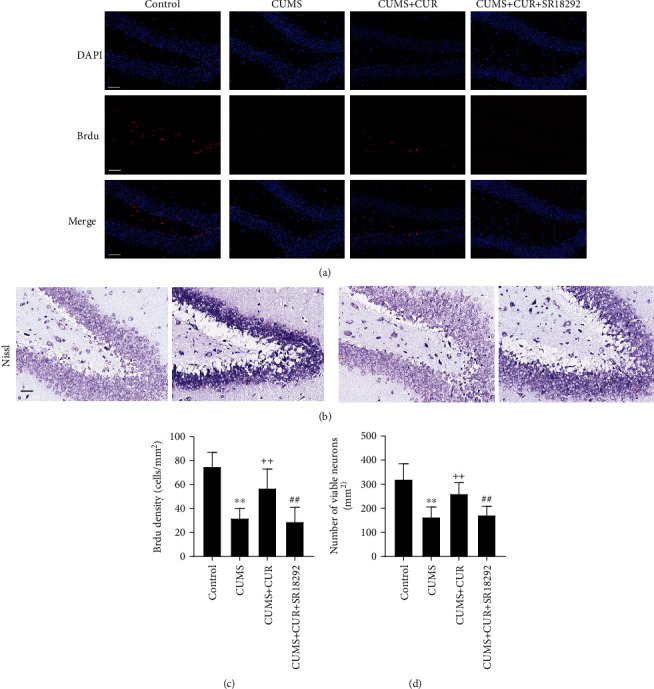
Figure 7.

(a) Representative images of immunofluorescence staining for Brdu positive cells. (b) Representative images of Nissl-stained neurons. (c) Quantification of BrdU fluorescence in the DG area of the hippocampus. (d) Quantification of viable neurons in the DG area of the hippocampus. Scale bar = 50 μm. Data are expressed as means ± SD (n = 7). ∗p < 0.05 and ∗∗p < 0.01 compared to the control group. +p < 0.05 and ++p < 0.01 compared to the CUMS group. #p < 0.05 and ##p < 0.01 compared to the CUMS + CUR group.
