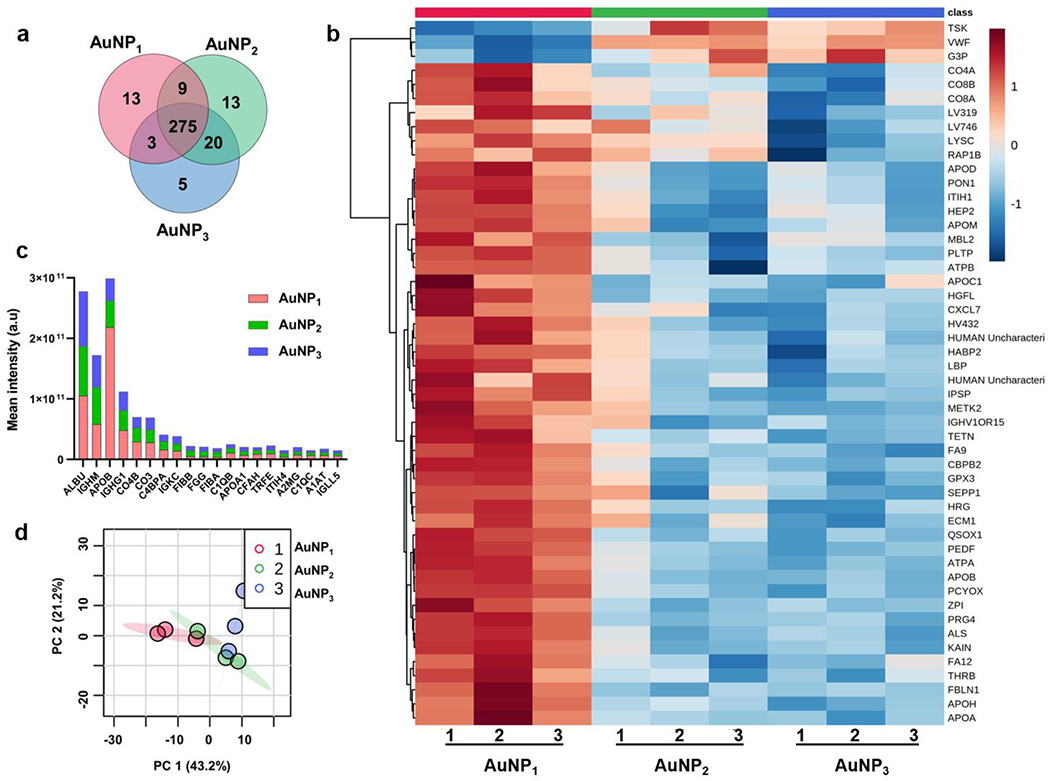
Figure 2.

Proteomic analysis of the plasma coronal proteins acquired by the three types of AuNPs. a) Venn diagram illustrating the distribution of coronal proteins associated with different AuNPs. b) Hierarchical clustering of the three types of AuNPs; AuNP1 (red), AuNP2 (green), and AuNP3 (blue). Vertical clustering displays similarities between sample groups, while horizontal clusters reveal the relative abundances of the 50 most significant different proteins ranked by p-values. White indicates no change, while red and blue indicate increased and decreased abundances, respectively. Ward’s minimum variance method algorithm was used to generate the hierarchical cluster analysis. c) Total mean intensity comparison of top proteins contributing more than 1% of the total protein abundance. d) Principal component analysis (PCA) score plot for different AuNPs showing variations in the AuNP groups. The data is from at least three independent biological replicates.
