
Figure 5.
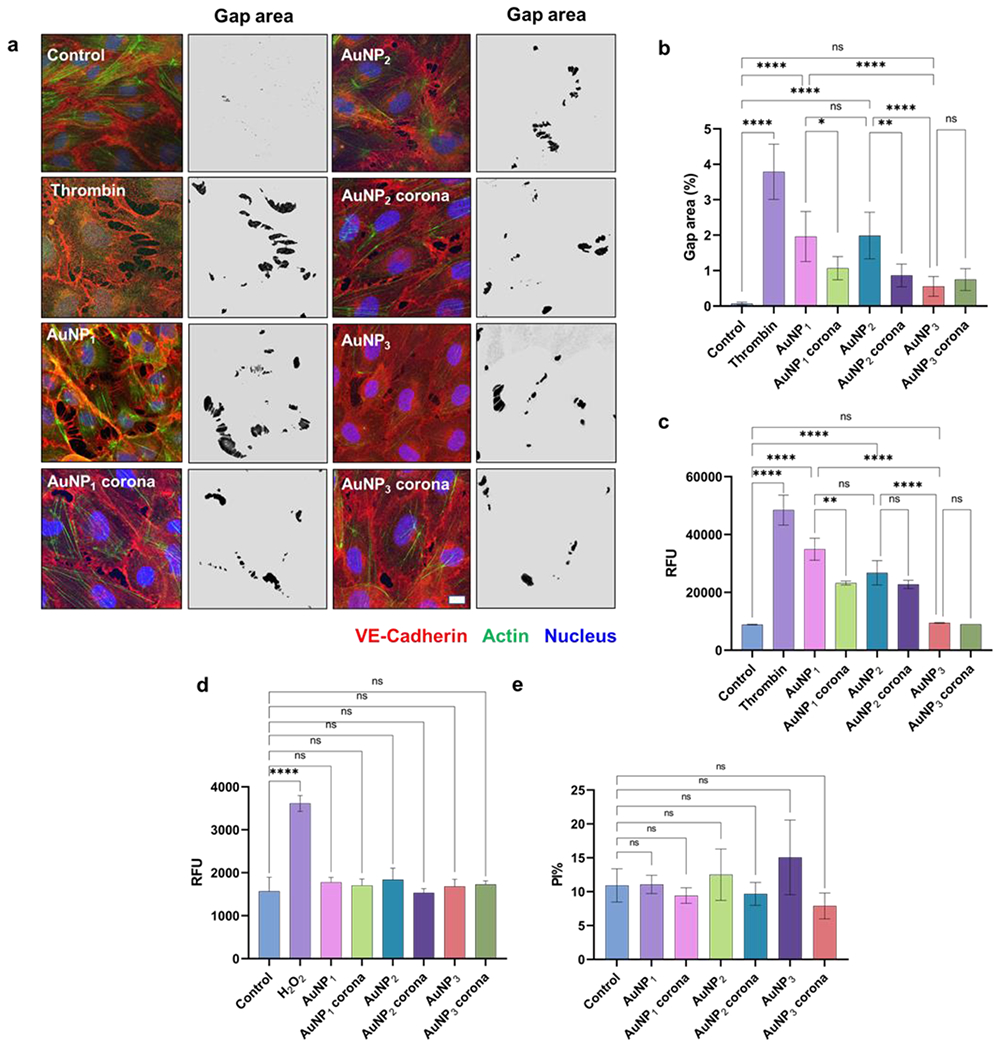
AuNP-induced endothelial leakage and influence of their protein corona on HUVEC cell monolayers. a) Confocal imaging and gap area analysis of cell control, thrombin, AuNP1-3, and AuNP1-3 coronae. b) Semi-quantitative image analysis of gap area% (shown in black in the images) highlighted on a grey background derived from the trainable Weka segmentation plugin in ImageJ software. HUVEC cells exposed to the AuNPs and their coronae evaluated by c) a transwell assay, d) ROS production, and e) a viability assay. Scale bars: 10 μm. *P < 0.05, **P < 0.001, ***P < 0.0005 and ****P < 0.0001.