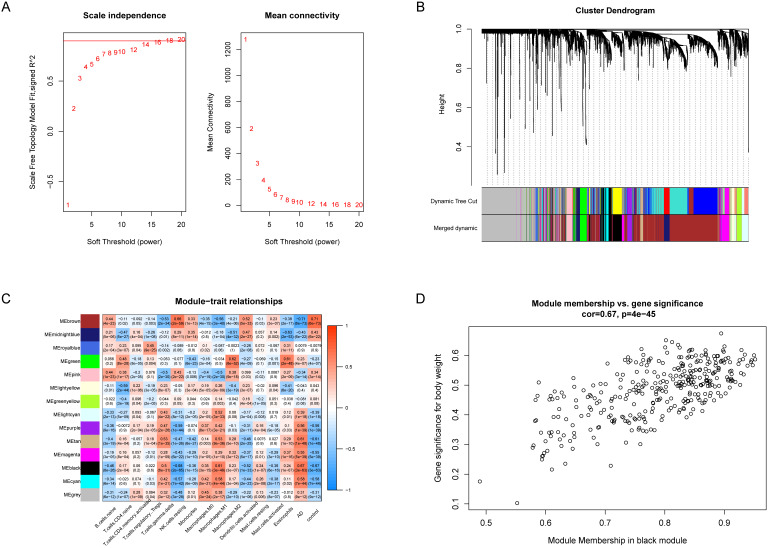
Figure 3.
WGCNA revealed gene co-expression networks and module-trait relationships. (A) Selecting the best soft threshold power β. (B) Dendrogram of top 25% variance genes. (C) The heatmap of module-trait relationships. The black module had the strongest correlation with M1 macrophages. (D) The scatterplot of gene significance (GS) against module membership (MM) in the black module.

