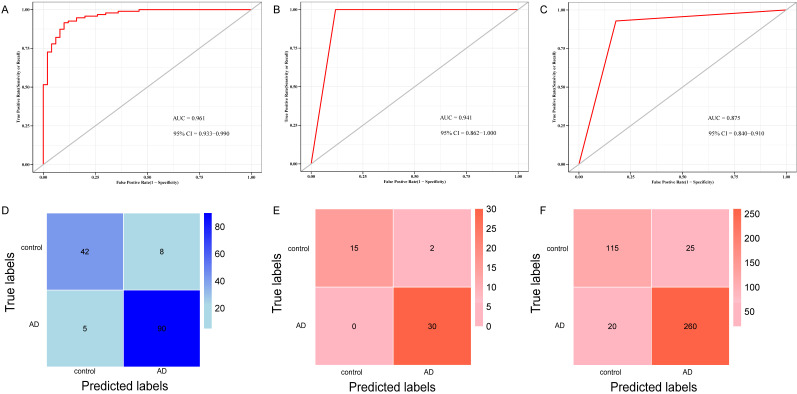
Figure 8.
ROC curve and confusion matrix of logistic model and k-fold cross-validation based on key genes. (A) ROC curve for distinguishing AD from control in the test cohort of logistic model. (B) ROC curve for distinguishing AD from control in the test cohort of the k-fold cross-validation. (C) ROC curve for differentiating AD from control in training cohort of the k-fold cross-validation. (D) Confusion matrix of the logistic regression model in test cohort. (E) Confusion matrix of the k-fold cross-validation in test cohort. (F) Confusion matrix of the k-fold cross-validation in training cohort.

