Figure 1.
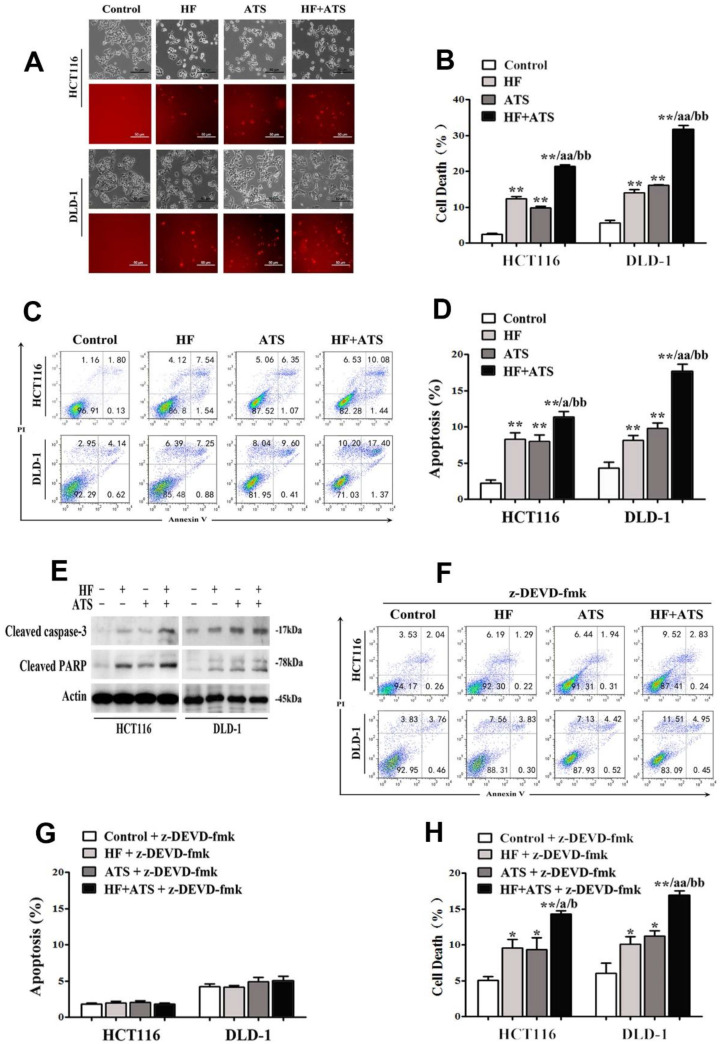
HF-ATS synergistically induces caspase-dependent apoptosis. (A, B) HF-ATS induces more cell death. In A, popidium iodide (PI) staining shows cell deaths, as seen through a light microscope, of HCT116 and DLD-1 cells treated with combination of HF (10 nM) and ATS (160 μM) for 24 h. Upper panel: phase-contrast; lower panel: PI staining. Scale bar = 50 μm. In B, cell death was quantified with flow cytometry. ** P < 0.01, compared with control group. aa P < 0.01, compared with HF. bb P < 0.01, compared with ATS. (C, D) HF-ATS induces increased apoptosis. In C, flow cytometry analyses of apoptosis in HCT116 and DLD-1 cells treated with combination of HF (10 nM) and ATS (160 μM) for 24 h. In D, apoptosis was quantified by Annexin V-FITC/PI staining coupled with flow cytometry. ** P < 0.01, compared with control group. a P < 0.05, compared with HF. bb P < 0.01, compared with ATS. (E) HF-ATS increases higher expression of cleaved caspase-3 and PARP in HCT116 and DLD-1 cells. (F, G) Apoptosis was blocked by caspase-3 inhibitor. In F, flow cytometry analyses of apoptosis regulated by combination of HF (10 nM) and ATS (160 μM) for 24 h in HCT116 and DLD-1 cells pretreated with caspase-3 inhibitor (z-DEVD-fmk). In G, apoptosis was quantified by Annexin V-FITC/PI staining coupled with flow cytometry. (H) Cell death was quantified by combination of HF (10 nM) and ATS (160 μM) for 24 h in HCT116 and DLD-1 cells pretreated with caspase-3 inhibitor (z-DEVD-fmk). * P < 0.05, ** P < 0.01, compared with control group. a P < 0.05, aa P < 0.01, compared with HF. b P < 0.05, bb P < 0.01, compared with ATS.

