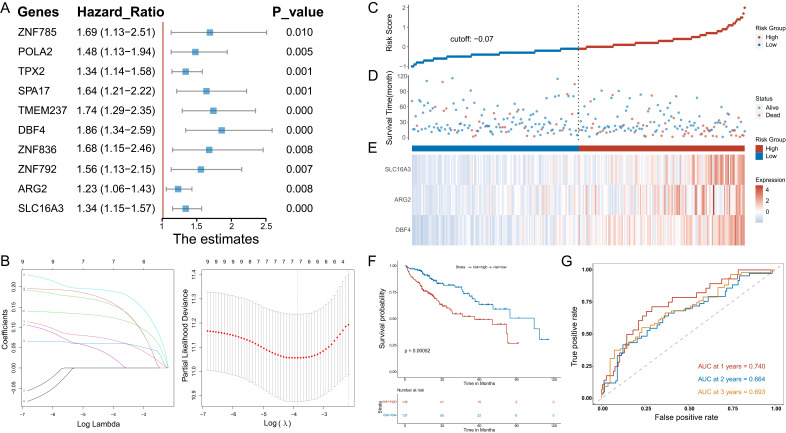
Figure 2.
Stepwise identification of key MVIRGs of the model and prognostic analysis in TCGA cohort. A: 10 MVIRGs significantly associated with the overall survival (OS) of patients with HCC. B: The result of LASSO regression for 10 MVIRGs. C: The risk score of each patient with HCC. D: The patient survival based on the risk score. E: The heat map of the three MVIRGs in the high-risk group and the low-risk group. F: Kaplan-Meier plot of patients in a low- or high-risk group (P = 0.00052), and the number of patients in different risk groups. G: Receiver operating characteristic (ROC) curve analysis for the prognostic value of the prognostic model for different years. Data from TCGA (median risk score as the cut-off value). AUC: area under the curve.

