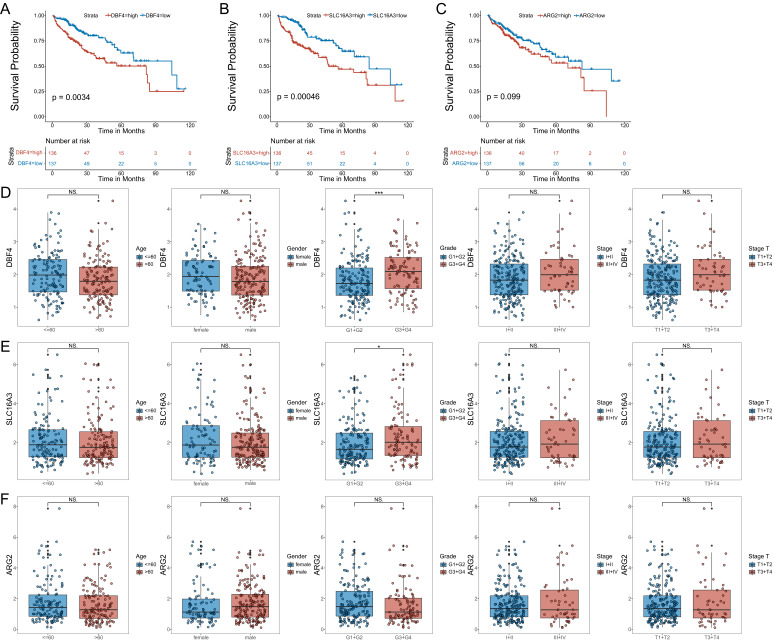
Figure 3.
The correlation between the respective expression levels of the three MVIRGs and the OS and the clinical data in patients with HCC. A: The Kaplan-Meier plot between the expression level of DBF4 and OS in patients with HCC (P = 0.0034), and the number of patients in different groups. B: The Kaplan-Meier plot between the expression level of SLC16A3 and OS in patients with HCC (P = 0.00046), and the number of patients in different groups. C: The Kaplan-Meier plot between the expression level of ARG2 and OS in patients with HCC (P = 0.099), and the number of patients in different groups.Date from TCGA (median risk score as the cut-off value). D: The correlation between the expression level of DBF4 and the clinical data. E: The correlation between the expression level of SLC16A3 and the clinical data. F: The correlation between the expression level of ARG2 and the clinical data. Data from TCGA. Clinical data: age (≤60 vs. >60), gender (female vs. male), grade (G1+G2 vs. G3+G4), stage (I+II vs. III+IV), stage T (T1 +T2 vs. T3+T4). NS: not significant; *P < 0.05, **P < 0.01, ***P < 0.001.

