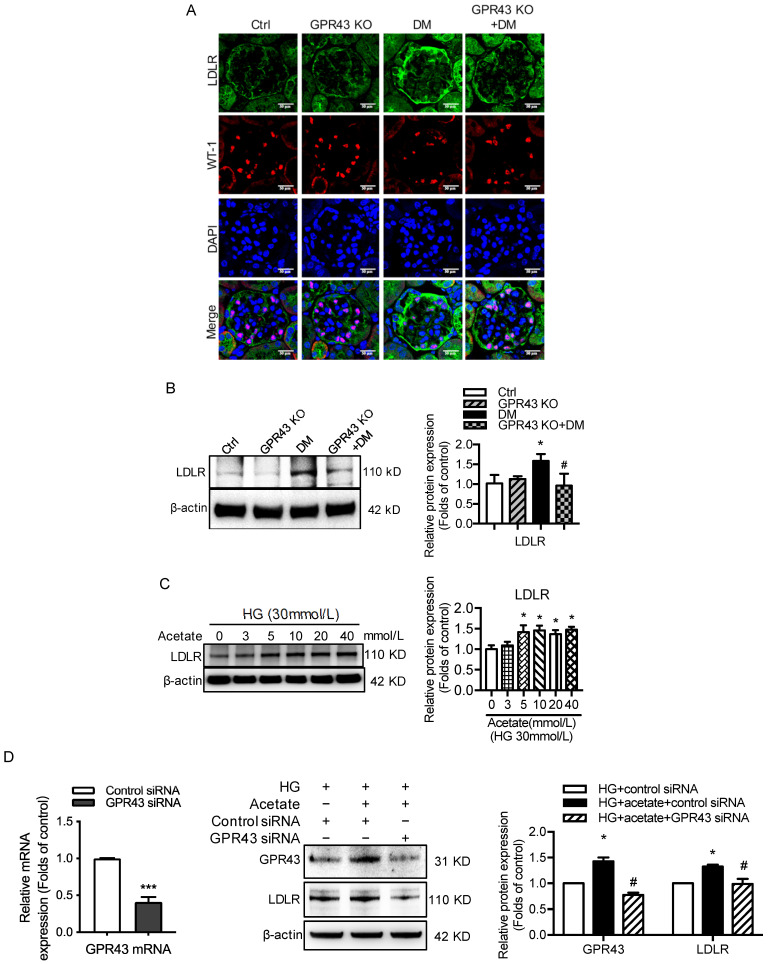
Figure 2.
GPR43 activation induced cholesterol accumulation in podocytes by increasing LDLR-mediated cholesterol uptake. A. The protein expression of LDLR in podocytes in kidneys was examined by immunofluorescent staining. The mice were divided into four groups: the control group (Ctrl, n=6), GPR43-KO group (n=6), diabetes group (DM, n=6), and GPR43-KO diabetes mice (GPR43-KO+DM, n=7). The mice were treated for 12 weeks. The fluorescent signals of LDLR (green), WT-1 (red), and nuclei (blue) were measured by confocal microscopy (original magnification × 400, scale bars, 50 µm). LDLR: low-density lipoprotein receptor; WT-1, Wilm's tumor protein-1, a specific biomarker of podocytes. B. The protein expression of LDLR in kidneys was examined by Western blotting. The mice were divided into four groups: the control group (Ctrl, n=6), GPR43-KO group (n=6), diabetes group (DM, n=6), and GPR43-KO diabetes mice (GPR43-KO+DM, n=7). The mice were treated for 12 weeks. The histogram shows the means ± SD of the densitometric scans of LDLR protein bands following normalization to β-actin. *P < 0.05 vs. Ctrl, #P < 0.05 vs. DM. C. The protein expression of LDLR in podocytes was examined by Western blotting. Podocytes were treated with different concentrations of acetate in the presence of HG for 24 hours. The histogram shows the means ± SD of the densitometric scans of LDLR protein bands following normalization to β-actin. *P < 0.05 vs. HG. D. The mRNA expression of GPR43 was examined by real-time PCR. The protein expression of GPR43 and LDLR in podocytes was examined by Western blotting. Podocytes were treated with or without acetate, GPR43 siRNA, or control siRNA (vehicle) for 24 hours in the presence of HG conditions. The histogram shows the means ± SD of the densitometric scans of GPR43 and LDLR protein bands following normalization to β-actin. *P < 0.05 vs. HG + control siRNA; #P < 0.05 vs. HG + acetate + control siRNA.

