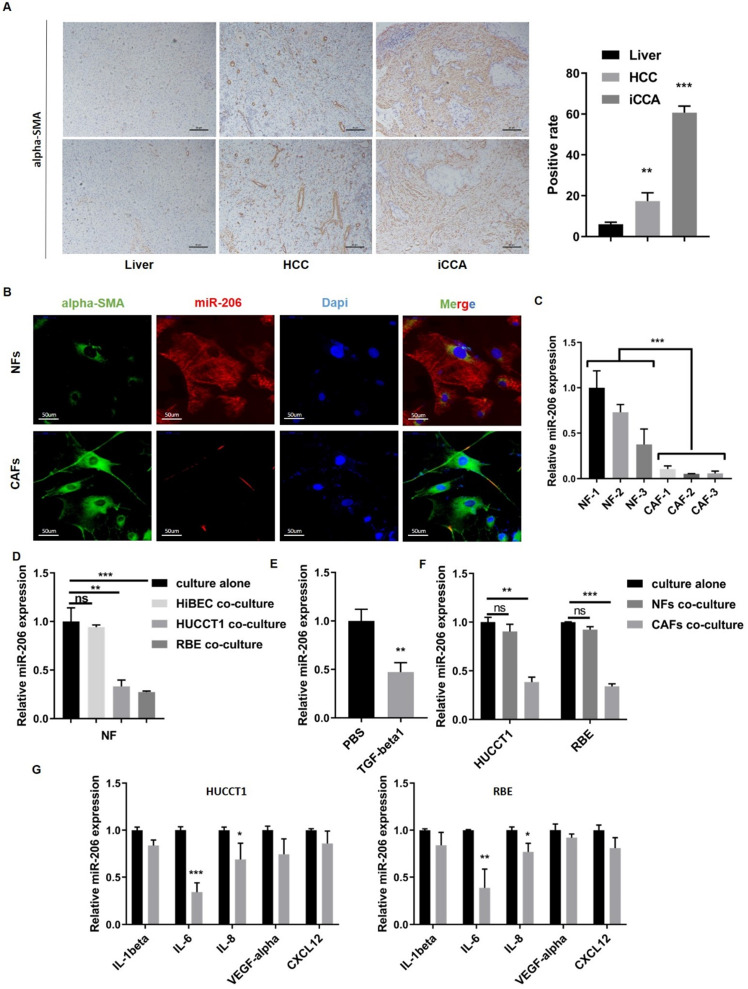
Figure 2.
Interaction between CCA cells and CAFs resulted in a further reduction in miR-206 expression. (A) Alpha-SMA staining in normal liver, hepatocellular carcinoma and intrahepatic cholangiocarcinoma tissues. The positive staining area was analyzed and is presented in the right panel. Scale bar= 20 µm. (B) Alpha-SMA and miR-206 expression in paired NFs and CAFs was detected by FISH. Scale bar=50 µm. (C) Expression of miR-206 in 3 pairs of NFs and CAFs was detected by qPCR. (D) Relative expression of miR-206 in NFs was analyzed when the NFs were cocultured with HiBEC, HUCCT1 or RBE cells for 48 hours or cultured alone as a control. (E) The fold change in the miR-206 levels in NFs treated with or without TGF-beta1 (20 ng/mL for 24 hours) was analyzed. (F) Changes in relative miR-206 expression in HUCCT1 and RBE cells cocultured NFs or CAFs were analyzed. (G) After treatment with IL-1beta, IL-6, IL-8, VEGF-alpha, and CXCL12 (20 ng/mL for 2 hours), the change in miR-206 expression in the HUCCT1 and RBE cell lines was analyzed, and PBS treatment was used as a control. The data are shown as the mean ± SD, * P <0.05, ** P <0.01, *** P <0.001.

