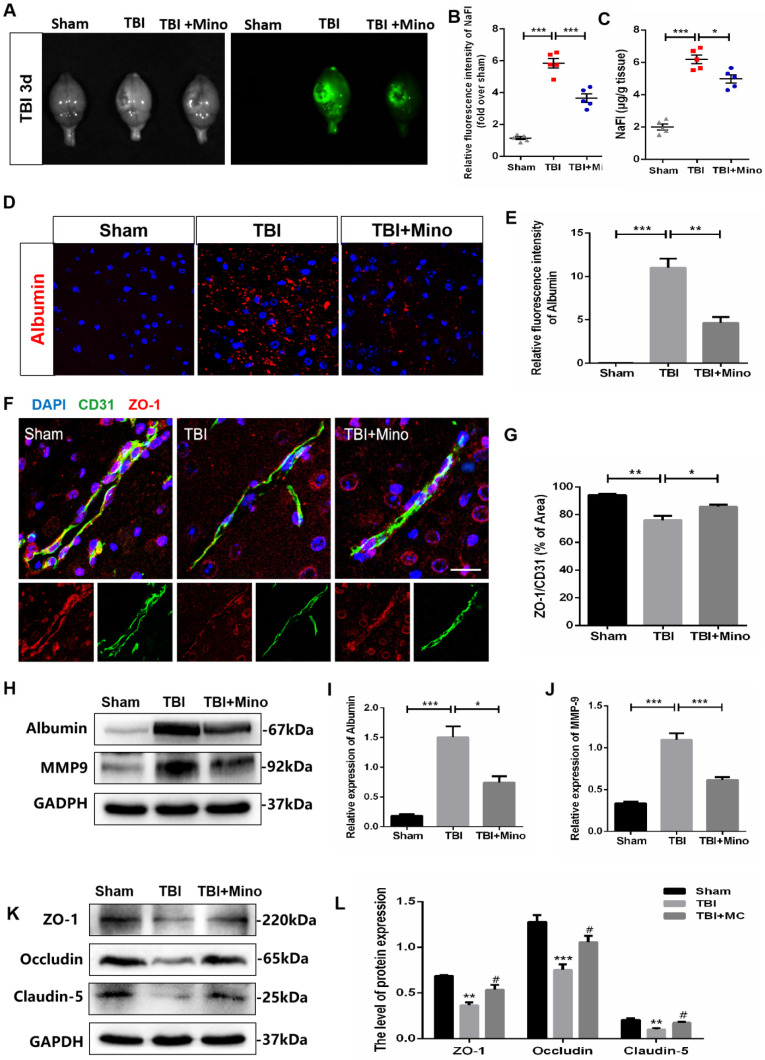
Figure 2.
Minocycline attenuates BBB dysfunction after TBI. (A) Representative images of fluorescent tracer sodium fluorescein (i.p. injection) leakage to visualize BBB disruption 3 day after TBI. Images of bright field (left) and fluorescent field (right) come from the same brains of each group. (B) Quantification of the relative fluorescence intensity of sodium fluorescein (NaFI). NaFI standard curve: y=6309.6x-263.5, R2= 0.9999. (C) Quantification of sodium fluorescein leakage (µg) per gram of the brain tissue from mice. n=5 mice per group. *P < 0.05, ***P < 0.001 vs. the indicated group. (D) Immunofluorescence images of Albumin (red) in perilesional cortex to indicate BBB disruption at 3 dpi. Scale bar= 50 µm, n= 3 per group. (E) Quantification of relative fluorescence intensity of Albumin. **P < 0.01, ***P < 0.001 vs. the indicated group. (F) Representative immunofluorescence images depicting ZO-1 (red) with CD31 (green) at 3 dpi. Scale bar = 25 µm, n= 3 per group. (G) Co-localization analysis of the ZO-1+ area and CD31+ area. *P < 0.05, **P < 0.01 vs. the indicated group. (H-J) Representative western blot analysis and quantification of Albumin and MMP-9 in ipsilateral cortex 3 day after TBI. n = 3 per group. *P < 0.05, ***P < 0.001 vs. the indicated group. (K-L) Representative western blot analysis and quantification of tight junction proteins (ZO-1, Occludin and Claudin-5) 3 day after TBI. n = 3 per group. **P < 0.01, ***P < 0.001 vs. Sham group, #P < 0.05 vs. the TBI group. All data represent the mean ± SEM.

