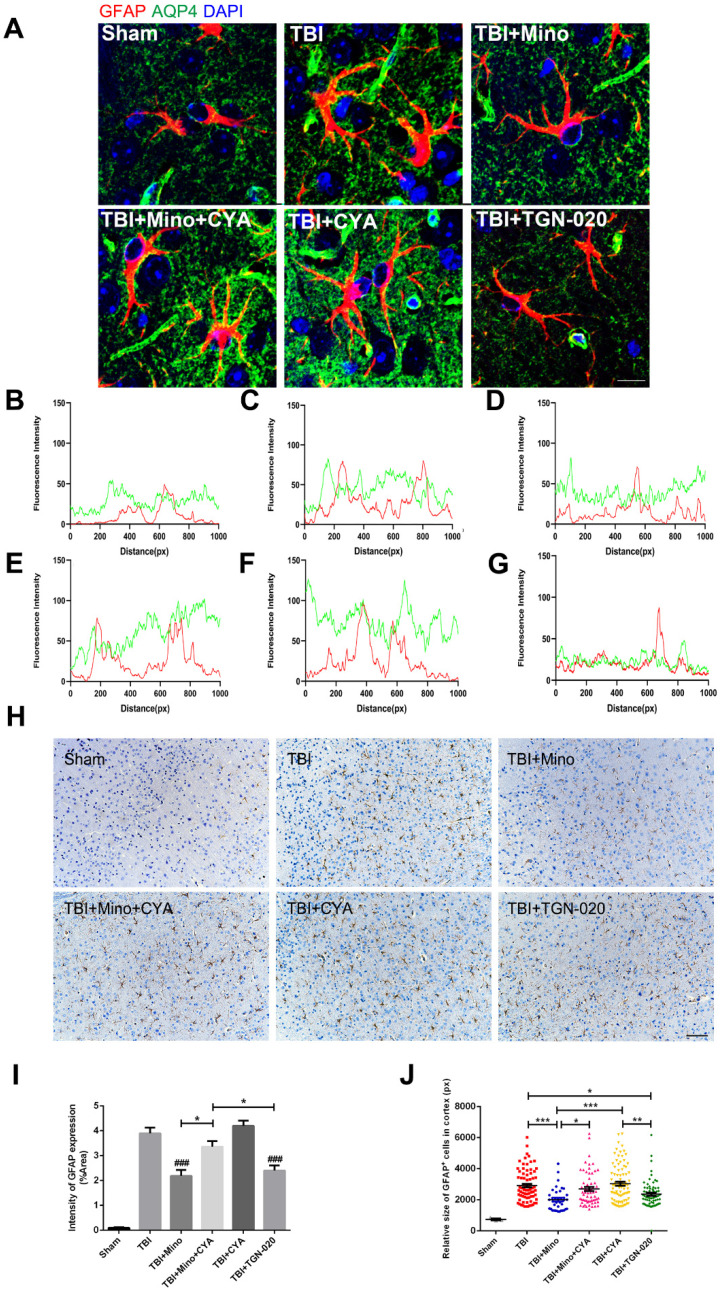
Figure 6.
Minocycline mediates astrocytic properties through regulation of AQP4 level in vivo. (A) Representative immunofluorescence images depicting GFAP (red) with AQP4 (green) at 3 dpi in six independent groups. Scale bar = 10 µm. (B-G) The overlap of fluorescence intensity peaks along profiles to show the co-localization of GFAP and AQP4 in each group. B: Sham group. C: TBI group. D: TBI+Mino group. E: TBI+Mino+CYA group. F: TBI+CYA group. G: TBI+TGN-020 group. (H) Immunohistochemistry staining of GFAP in the perilesional cortex. Scale bar = 200 µm. (I) Quantification of relative intensity of GFAP positive area (% of Area). n=5 per group. ### P < 0.001 vs. the TBI group. (J) Quantification of relative size for each GFAP+ cells in the perilesional cortex. All data represent the mean ± SEM. *P < 0.05, **P < 0.01, ***P < 0.001 vs. the indicated group.

