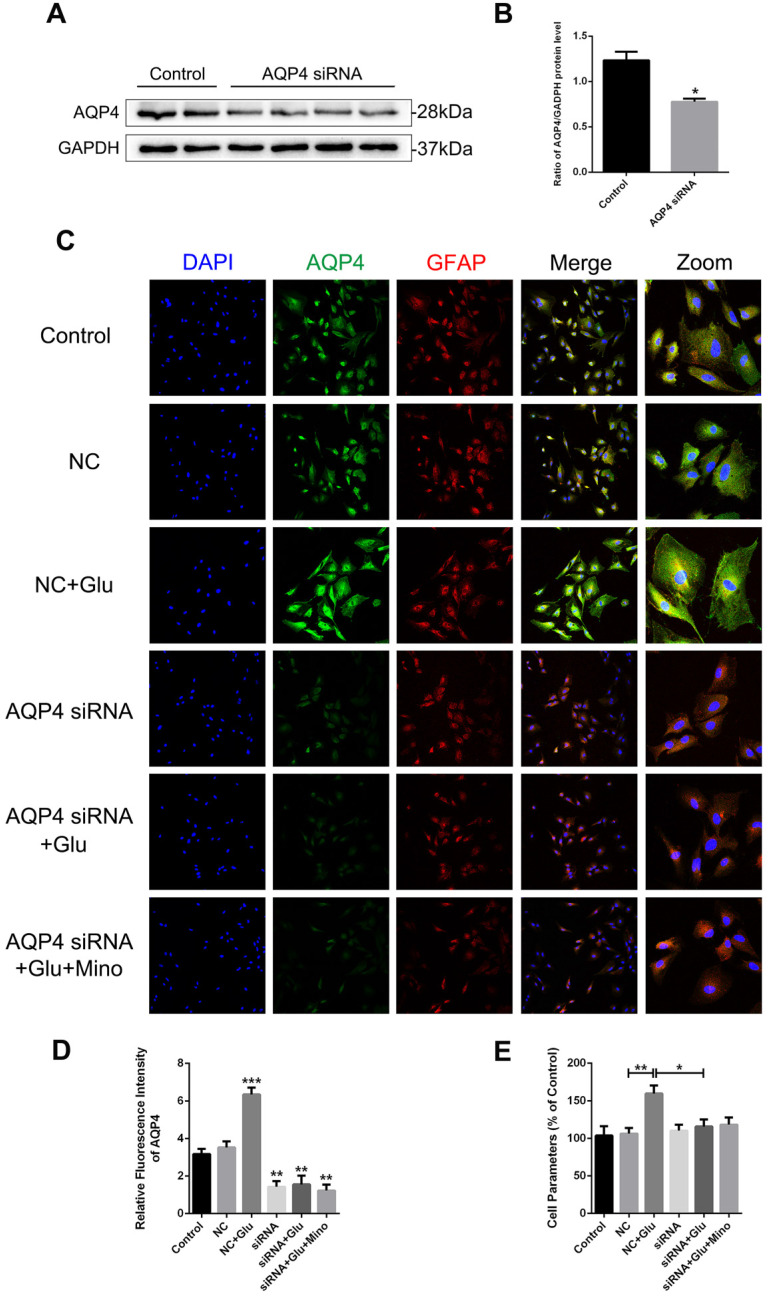
Figure 8.
AQP4 siRNA abolishes glutamate-induced astrocyte swelling in vitro. (A, B) Western blot analysis and quantification of AQP4 expression between the control group and AQP4 siRNA treated group. n=4 per group. *P < 0.05 vs. the control group. (C) Representative images of immunofluorescence staining depicting GFAP (red) with AQP4 (green) in primary culture astrocytes after incubation with AQP4 siRNA, glutamate and minocycline, respectively. NC represented negative control. Scale bar=100 µm. (D) Quantification of fluorescence intensity of AQP4 in each group. n=3 per group. *P < 0.05, ***P < 0.001 vs. the control group. (E) Quantitative analysis of image data from (C) to represent the astrocyte volume by cell parameter method. n=6 per group. *P < 0.05, **P < 0.01 vs. the indicated group. All data represent the mean ± SEM.

