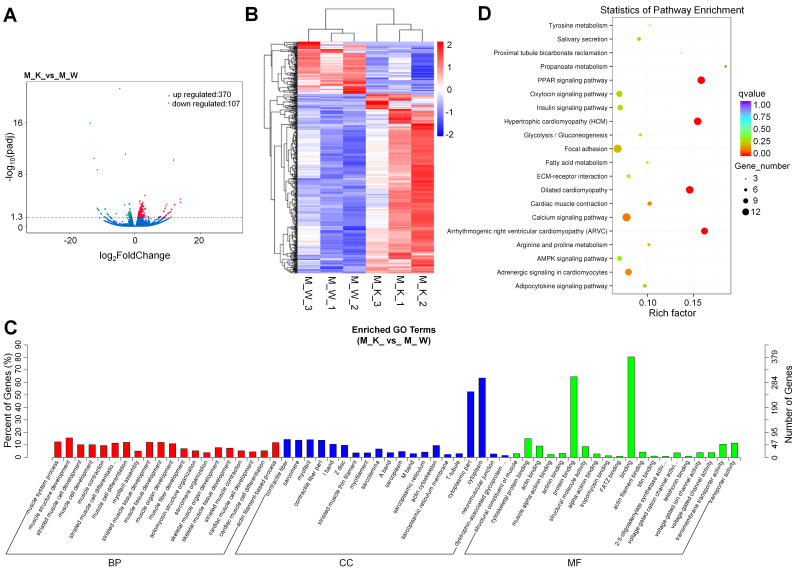
Figure 1.
Overview of mRNA expression. (A) Volcano plots for mRNA. (B) Heatmap is used to assess the expression of mRNA. Red and blue denote high and low expression, respectively. Each DE-miRNA is represented by a single row of colored boxes, and each sample is represented by a single column. (C) Go term analysis of mRNA. (D) KEGG analysis of DE mRNA.

