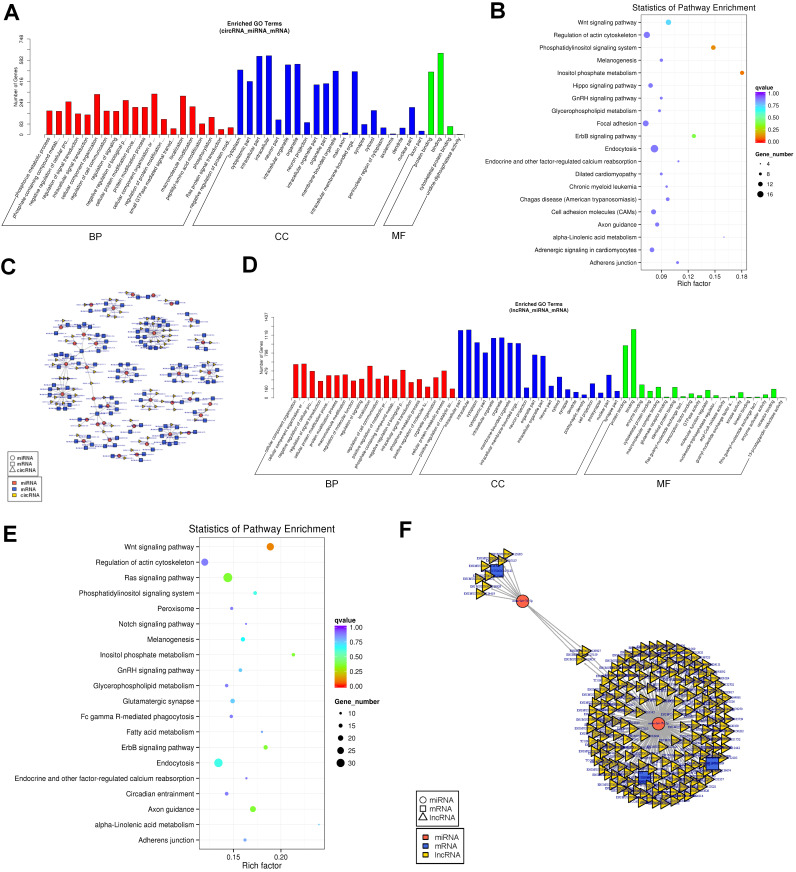
Figure 5.
Established circRNA-miRNA-mRNA and lncRNA-miRNA-mRNA network.(A)GO analysis of the DEGs in the circRNA-miRNA-mRNA network. (B)KEGG analysis of the DEGs in the circRNA-miRNA-mRNA network. (C)The circRNA-miRNA-mRNA Competing endogenous RNA network. The squares indicate mRNAs in blue, triangles represent lncRNAs in light yellow and round shapes represent miRNAs in orange. (D)GO analysis of the DEGs in the lncRNA-miRNA-mRNA network. (E) KEGG analysis of the DEGs in the lncRNA-miRNA-mRNA network. (F)The lncRNA-miRNA-mRNA Competing endogenous RNA network. The squares indicate mRNAs in blue, triangles represent lncRNAs in light yellow and round shapes represent miRNAs in orange.

