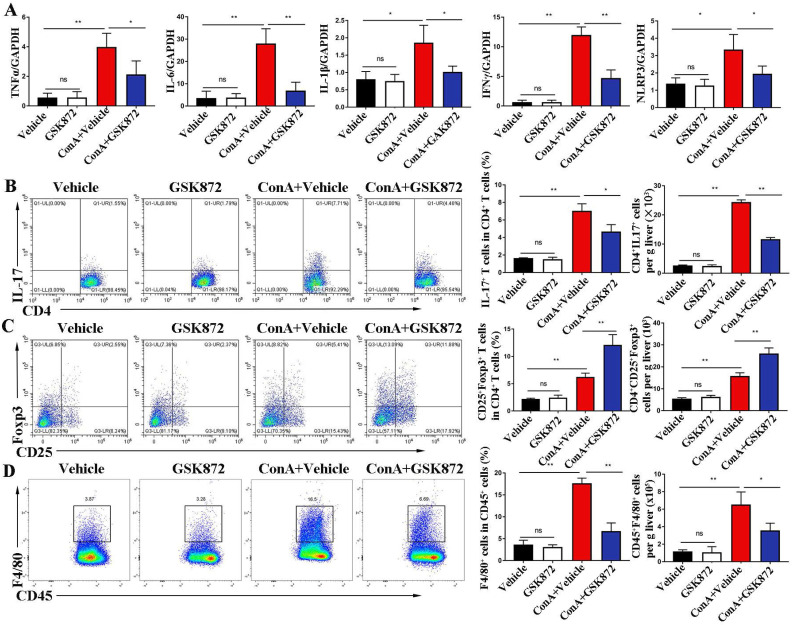
Figure 3.
RIP3 blockade inhibits ConA-induced hepatic immune activation. (A) Expression levels of TNF-α, IL-6, IL-1β, IFNγ, and NLRP3 in livers were analyzed by RT-qPCR. Gene expression was normalized to GAPDH levels. Fractions of CD4+IL-17+ cells (B) and CD4+CD25+ Foxp3+ cells (C) in liver CD4+ T cells were assessed by flow cytometry. Representative scatter plots (left) are presented, and the histogram (right) represents the statistical analysis of the percentages of gated in liver CD4+ T cells. (D) Flow cytometry analysis of CD45+F4/80+ macrophages in CD45+ HMNCs (left). The histogram (right) represents the statistical analysis of the percentages of CD45+F4/80+ macrophages in CD45+ HMNCs. All the values are shown as mean ± SD. ns, not significant; *P < 0.05, **P < 0.01.

