Fig. 3.

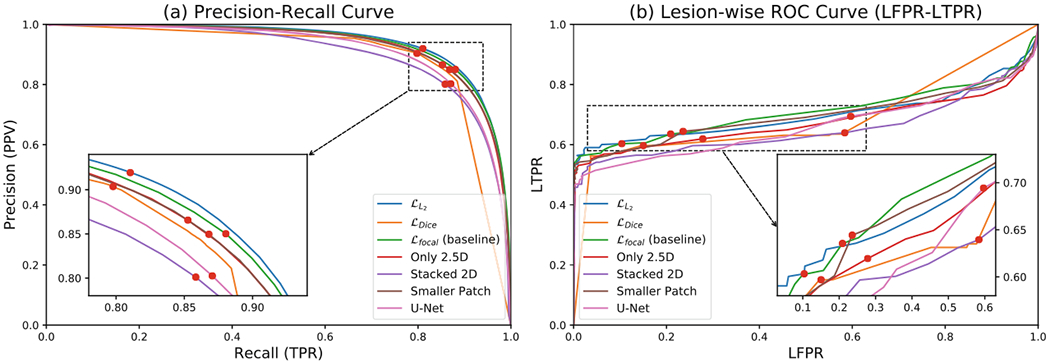
Precision-Recall and Lesion-wise ROC (LFPR-LTPR) curves for the ablation study. The in-set figures provide zoomed-in views. The red dots indicate when the threshold is set to 0 (the membership function values are in the range [−1, 1]).

Precision-Recall and Lesion-wise ROC (LFPR-LTPR) curves for the ablation study. The in-set figures provide zoomed-in views. The red dots indicate when the threshold is set to 0 (the membership function values are in the range [−1, 1]).