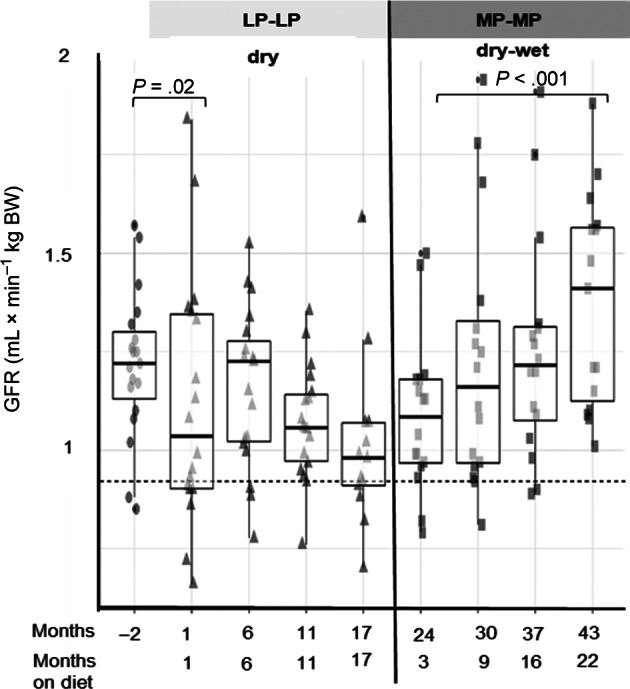
FIGURE 3.

Boxplots with whiskers with maximum 1.5 IQR showing the progression of glomerular filtration rate (GFR) with each dietary intervention. LP‐LP, low protein low phosphorus; MP‐MP, moderate protein moderate phosphorus. Dashed line represents the lower reference for GFR at 0.92 mL × min−1 × kgBW−1
