
FIGURE 4.
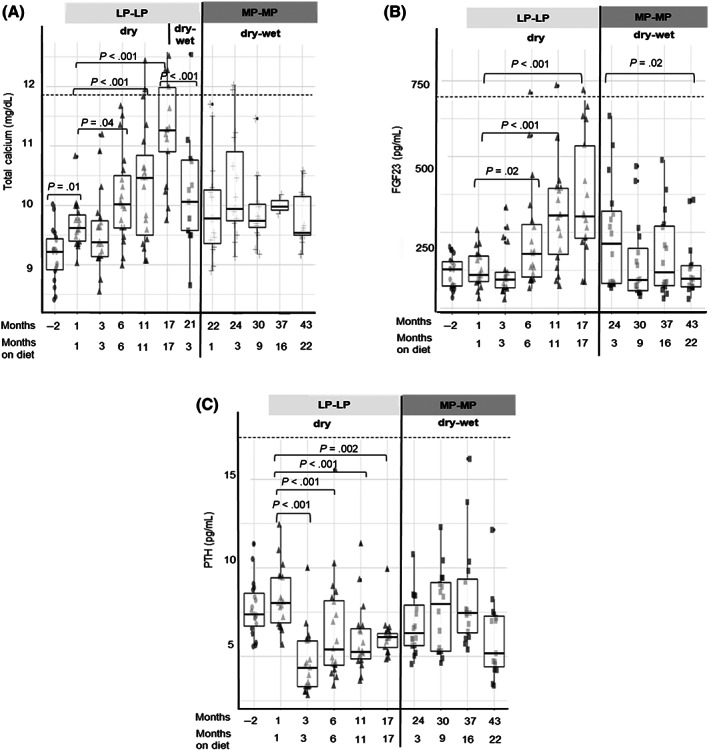
Boxplots with whiskers with maximum 1.5 IQR showing the evolution of (A) serum total calcium, (B) plasma FGF23, and (C) PTH with each dietary intervention. LP‐LP, low protein low phosphorus; MP‐MP, moderate protein moderate phosphorus. Dashed lines represent the physiological upper reference