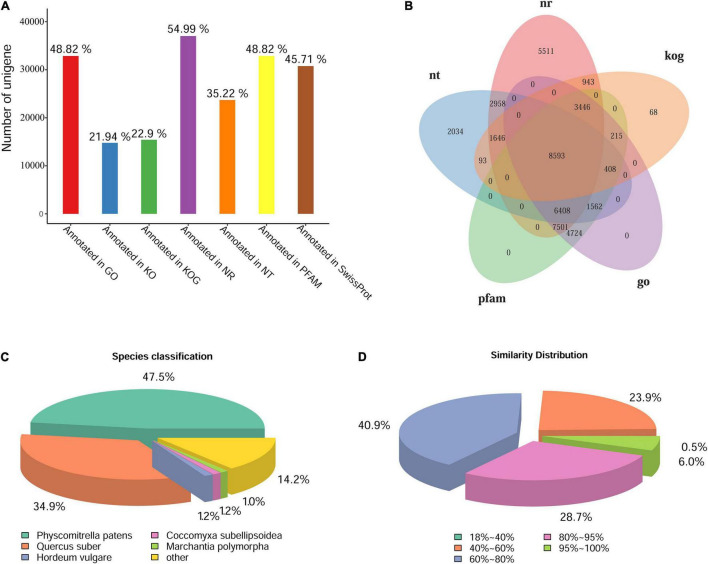
FIGURE 3.
The statistics of functional annotation of the Antarctic moss genes. (A) The statistics of gene annotation rate in seven databases. (B) Venn diagram of five database annotation results. (C) The statistics of species classification. (D) The statistics of similarity distribution. Bar = 0.5 cm.

