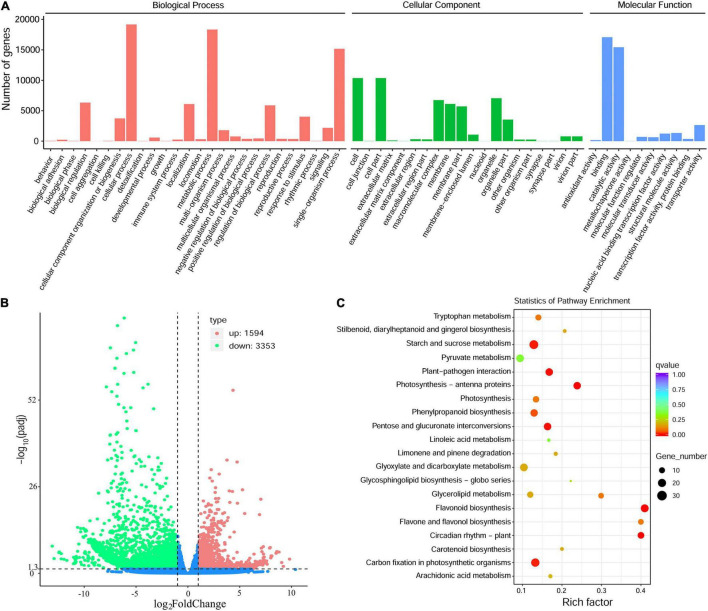
FIGURE 4.
Transcriptome sequencing of the Antarctic moss under UV-B light. (A) The classification of Gene Ontology of L. pyriforme unigenes. (B) The volcano plot showing the DEGs between UV-B radiation group and control group. The X-axis indicates fold change of gene expression (threshold, | log2(Treat/Control)| > 1), while the Y-axis means the statistically significant level (threshold, q-value < 0.005). (C) KEGG pathway enrichment of DEGs. Rich factor represents the ratio of the number of DEGs to the total number of annotated genes in this pathway.

